


Pi Network Price Forecast: PI rebound loses steam ahead of critical resistance trendline



- Pi Network hovers around $0.0700 on Thursday, consolidating after Tuesday’s 8% rebound.
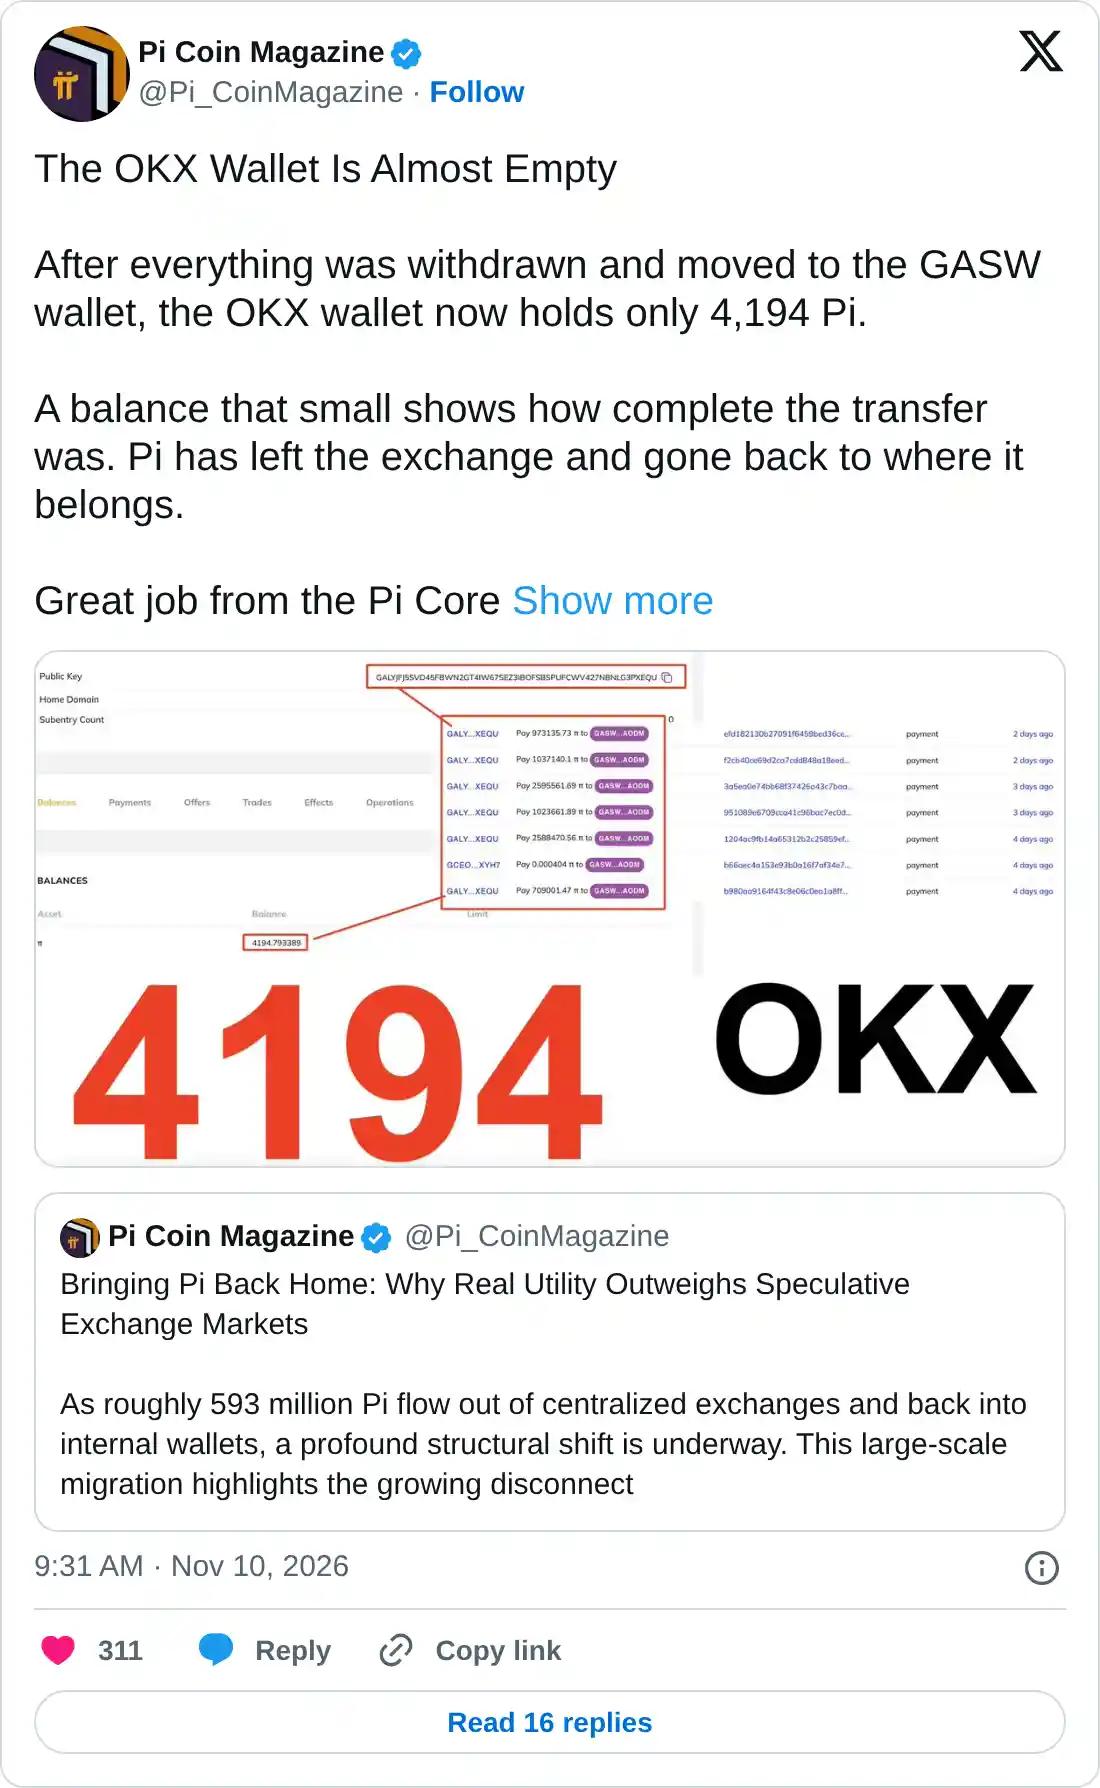
- Over 590 million PI have flown from OKX’s exchange wallet to the GASW wallet this week, reducing available selling pressure.
- The technical outlook for PI remains bearish, as the price is capped below a long-term descending trendline near $0.0730.
Pi Network (PI) price is holding steady around $0.0700 at press time on Thursday, consolidating around the round figure after Tuesday’s 8% rebound. The rebound coincided with a massive outflow of more than 590 million PI tokens from the OKX exchange wallet, suggesting reduced downside pressure. Technically, the PI remains capped below a key trendline around $0.0730, maintaining a bearish bias.
OKX exchange PI wallet drain
The OKX exchange wallet holding PI saw a massive withdrawal of 593 million tokens on Tuesday, reducing the amount of supply available for sale. This outflow increases the Pi concentration among non-selling holders, projecting long-term upside potential.
Technical outlook: Will PI extend gains for a breakout rally?
Pi Network trades at $0.0702 at press time on Thursday, extending its bearish tone below a capped resistance around $0.0730. The PI token is also trading below both the 50-day Exponential Moving Average (EMA) at $0.0792 and the 200-day EMA at $0.1097.
Momentum remains soft on the daily chart, with the Relative Strength Index (RSI) hovering around 36 and the Moving Average Convergence Divergence (MACD) below zero, suggesting lingering downside pressure.
On the topside, the immediate resistance aligns with a rising trendline around $0.0730, reinforced by the 50-day EMA at $0.0792. Further up, medium-term resistance is layered at the 50% retracement of the downswing from $0.1394 to $0.0704, at $0.1049, and at the 200-day EMA at $0.1097.
Looking down, if PI extends below the descending trendline, the 127.2% Fibonacci extension level at $0.0516 could serve as a base for buyers to step in.
(The technical analysis of this story was written with the help of an AI tool. Know more.)
Recommended Articles









Comments (0)
Click the $ button, enter the symbol, and select to link a stock, ETF, or other ticker.