


Pi Network Price Forecast: PI extends gains as ecosystem development supports recovery



- Pi Network extends gains, trading above $0.097 on Monday after two consecutive weeks of gains.
- PiCore Team’s latest SoloHost and Pi Desktop updates improve app discovery, reliability and developer tools, boosting ecosystem utility.
- Momentum indicators point to a tentative recovery, but overhead EMAs remain a challenge.
Pi Network (PI) extends its recovery on Monday, trading above $0.097 after two consecutive weeks of gains. Continued ecosystem development and improved developer tools are boosting utility. Meanwhile, the technical indicators point to a tentative recovery, but overhead Exponential Moving Averages (EMAs) remain a challenge and cap PI gains.
Pi Network expands ecosystem utility as PI recovers
PiCoreTeam announced last week that it released SoloHost updates alongside Pi Desktop version 0.6.3. This improves app discovery, reliability, and developer tools, PiCoreTeam said in its X post.
These ongoing developments and announcements support PI’s recovery, which gained 1.68% last week and extended gains on Monday, as continued ecosystem development strengthens the network’s utility.
Pi Network Price Forecast: Extends gains
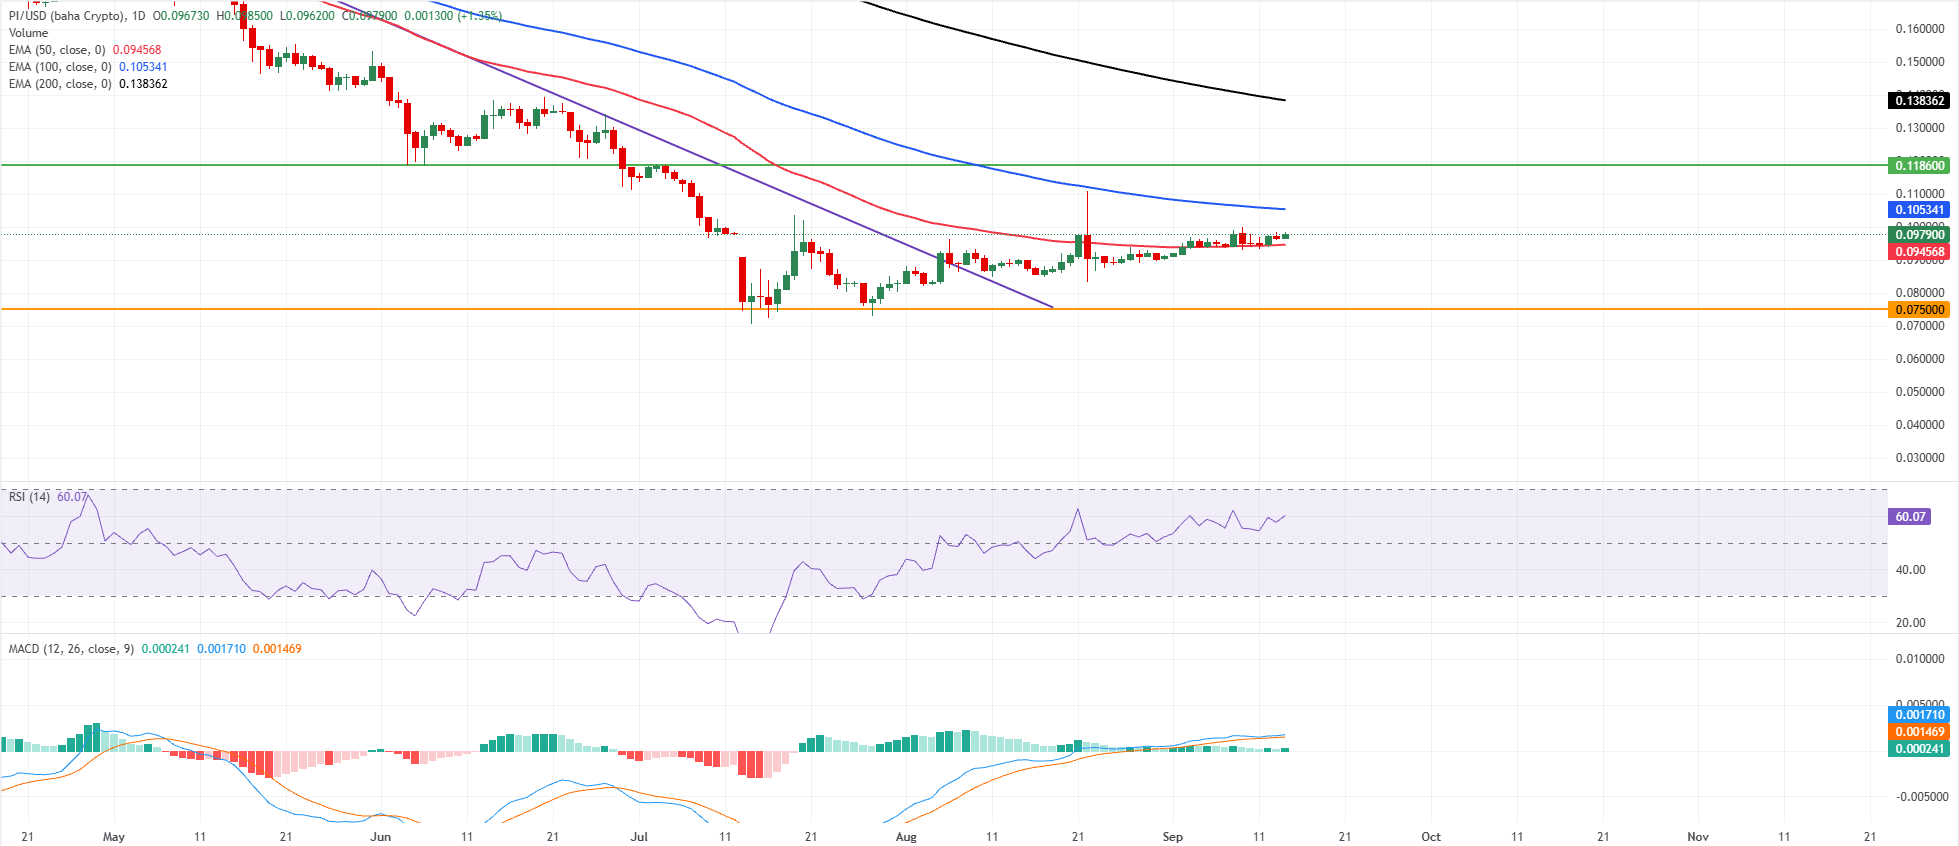
Pi Network trades at $0.097 on Monday, holding just above the 50-day Exponential Moving Average (EMA) at $0.094 but still capped beneath the 100-day EMA at $0.105 and the 200-day EMA at $0.138, keeping the broader bias bearish despite recent stabilization.
The Relative Strength Index (RSI) around 60 hints at improving upside momentum, while the Moving Average Convergence Divergence (MACD) remains marginally positive, suggesting a tentative recovery attempt that remains challenged by overhead EMAs.
On the topside, immediate resistance aligns at the 100-day EMA near $0.105, ahead of a more substantial barrier at the horizontal level around $0.118, with the 200-day EMA near $0.138 reinforcing a wider bearish cap.
On the downside, initial support is seen near the current price, clustered with the 50-day EMA at $0.094, followed by the horizontal floor at $0.075, while the prior trendline break area around $0.045 marks a deeper structural base if selling pressure resumes.
(The technical analysis of this story was written with the help of an AI tool. Know more.)
Recommended Articles









Comments (0)
Click the $ button, enter the symbol, and select to link a stock, ETF, or other ticker.