


Crypto Market Overview: Mild correction in Bitcoin – HYPE, TIA extend losses



- Bitcoin extends losses on Friday, edging below $64,000 amid easing bullish momentum.
- Hyperliquid holds at $60 on Friday, following a 9% drop the previous day.
- Celestia is down 4% on Friday, testing a breakout below its 50-day EMA around $0.3838.
Bitcoin (BTC) edges below $64,000 on Friday, extending losses for the third consecutive day after the 50-day Exponential Moving Average (EMA) capped recovery around $65,000. Hyperliquid (HYPE) and Celestia (TIA) stand out as the worst performers over the last 24 hours, with nearly 10% losses.
Bitcoin extends decline below its 50-day EMA
Bitcoin edges below $64,000 on Friday, maintaining a bearish near-term tone as it remains below the 50-day EMA at $65,041 and the 200-day EMA at $75,025. Momentum is mixed, with the Moving Average Convergence Divergence (MACD) indicator still in positive territory and the Relative Strength Index (RSI) dipping to the neutral 50 level, suggesting consolidation rather than a decisive recovery.
Bitcoin must clear the 50-day EMA at $65,041 for a steady recovery, which could target the $70,000 psychological threshold.
On the downside, the key structural floor is the horizontal support at $60,000, where a sustained break would likely reopen a broader corrective phase in the daily picture.
Hyperliquid and Celestia take a bearish reversal
Hyperliquid hovers around $60 at press time on Friday, maintaining a bearish near-term bias after breaking below its 50-day EMA at $63.09, with a 9% drop the previous day. Still, the longer-term 200-day EMA at $49.85 underpins the broader structure.
The MACD descends into negative territory with a bearish profile, and the RSI near 41 suggests subdued momentum, reinforcing the downside pressure.
The path of least resistance for HYPE targets the previous swing low from June 10 at $52.67, followed by the 200-day EMA at $49.85.
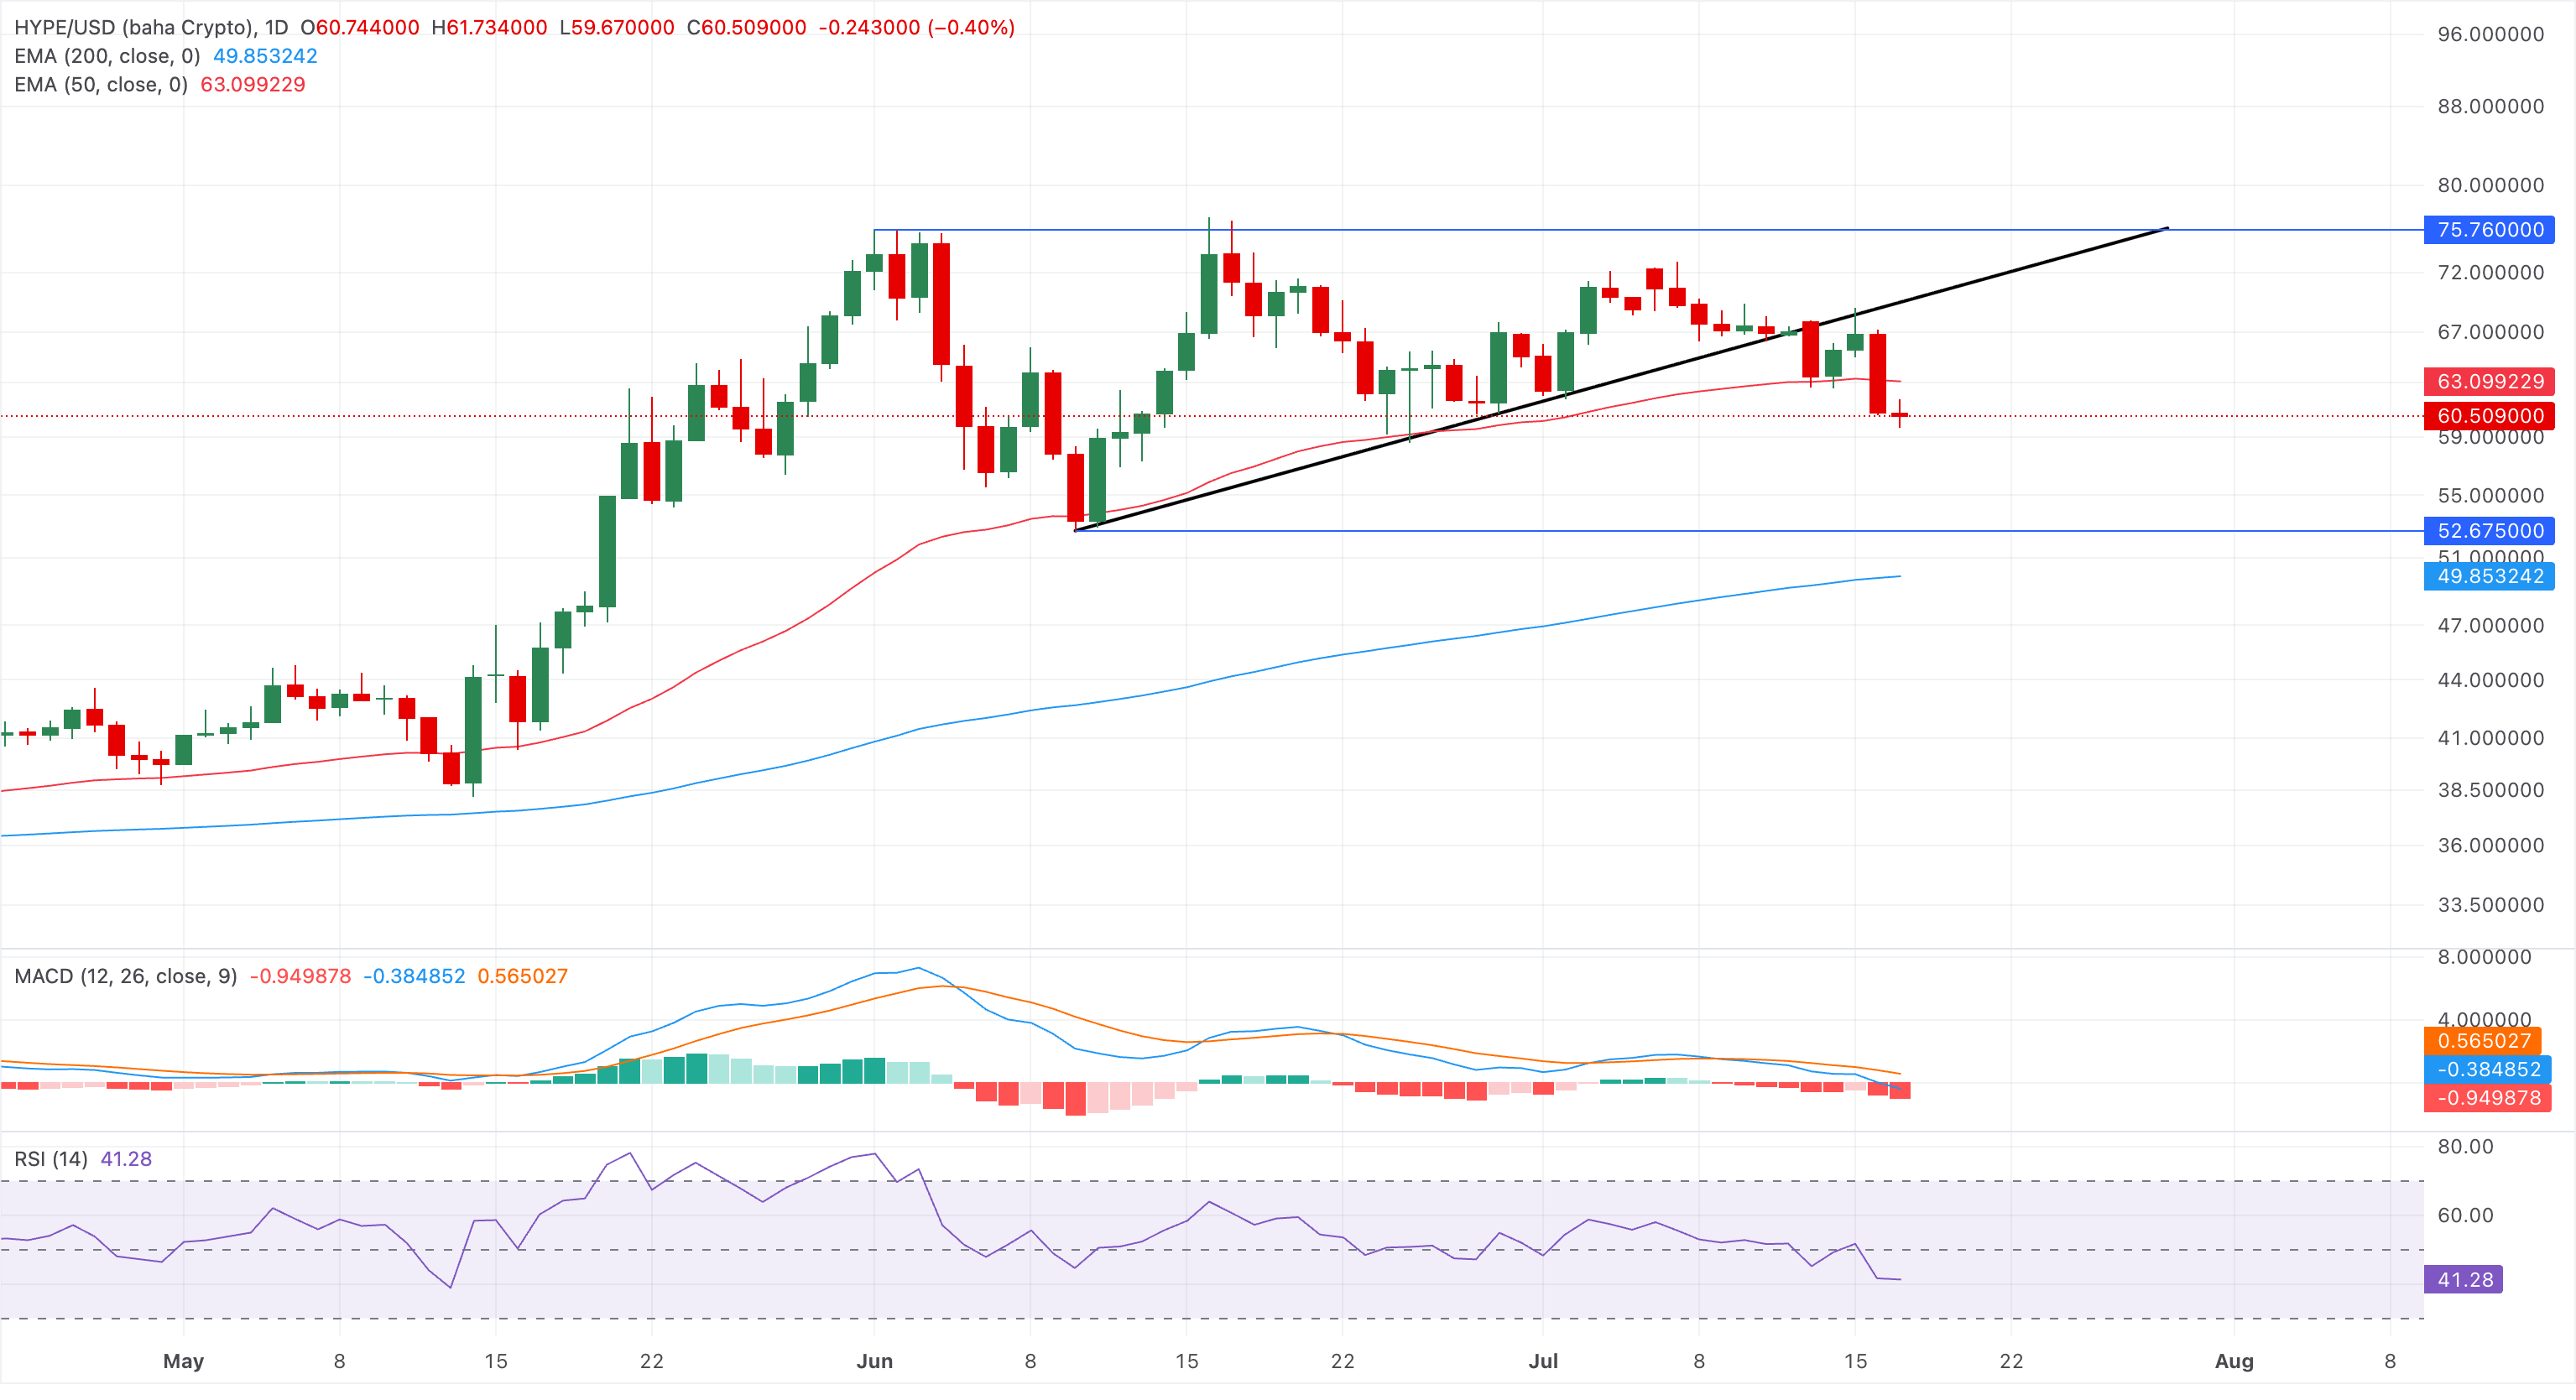
On the topside, initial resistance is at the 50-day EMA at $63.09, with a stronger barrier at the former upward-sloping trendline break near $70.29.
Celestia maintains a bearish near-term bias, testing its 50-day EMA at $0.3838 on Friday, which is well below the 200-day EMA at $0.5053. This positioning suggests the broader trend remains pressured, after price failed to surpass the 50% retracement level at $0.4104, measured over the downswing from $0.6257 to $0.2693.
The RSI around 47 hints at neutral-to-slightly soft momentum, while the MACD has slipped marginally below zero, reinforcing a loss of upside conviction following recent rebounds.
Looking down, the 23.6% retracement at $0.3285 is the first notable support, ahead of the structural cycle low at $0.2693, where buyers are expected to defend the broader range.
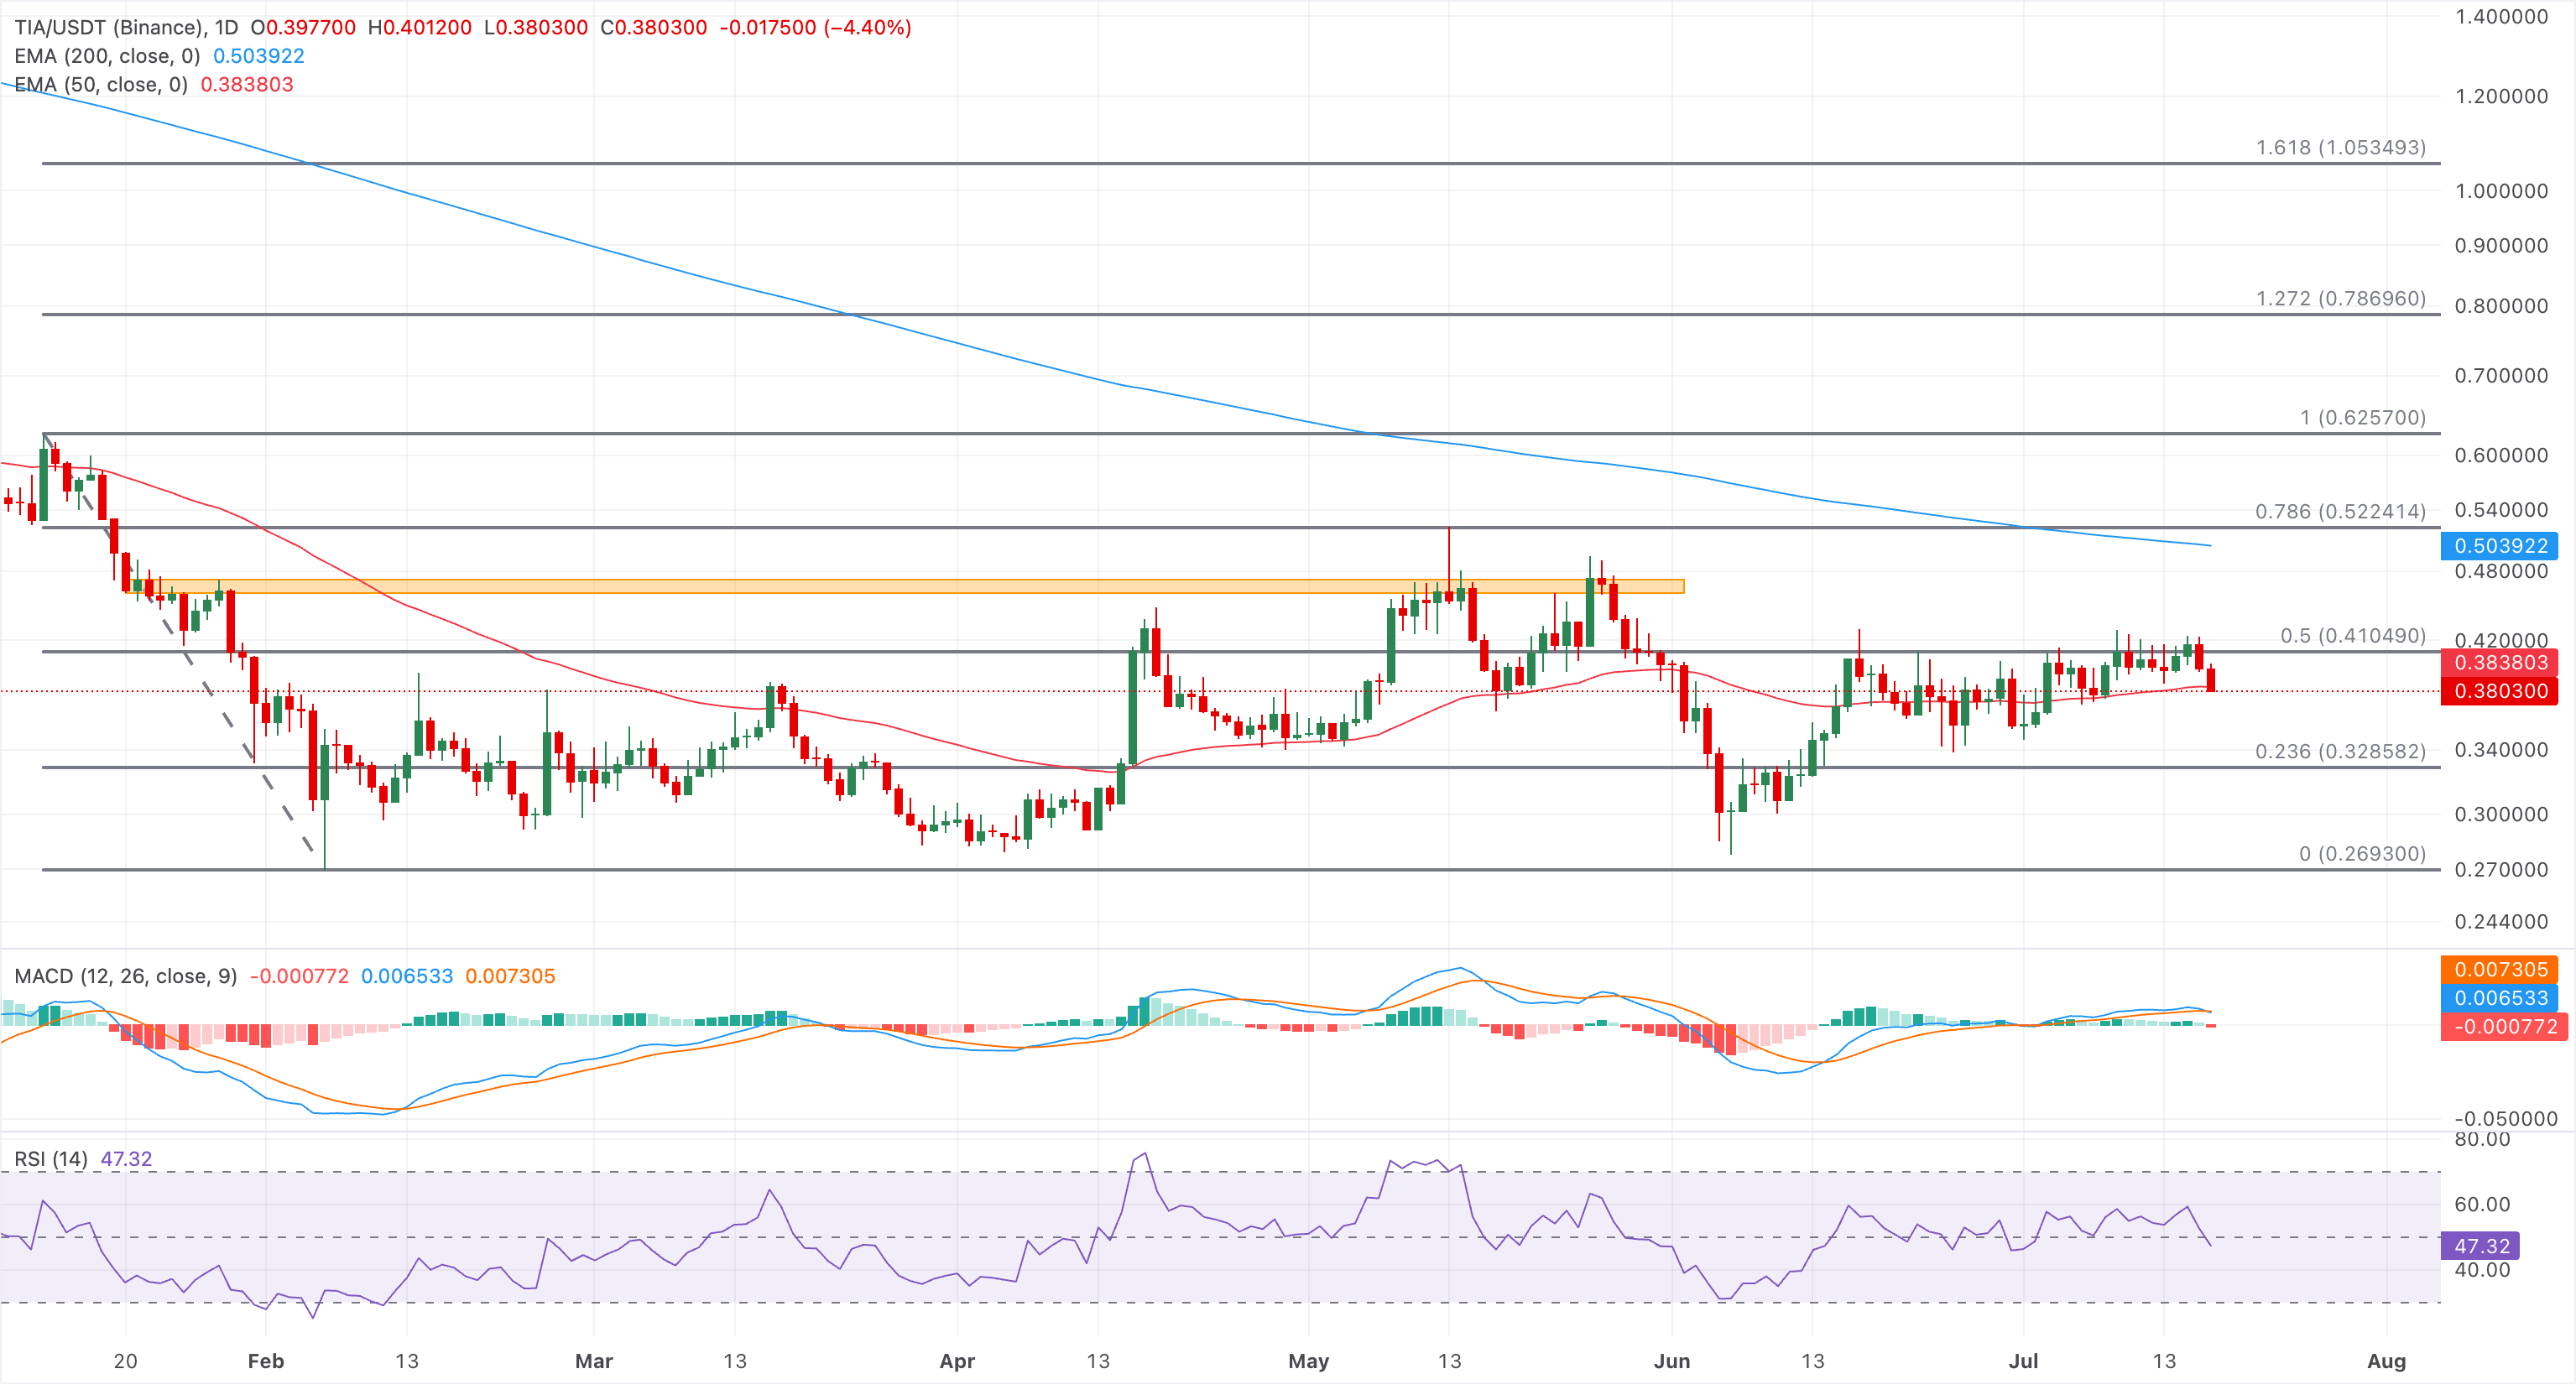
On the topside, initial resistance is seen at the 50% retracement at $0.4104, before the 200-day EMA at $0.5053, which caps the long-term recovery potential.
(The technical analysis of this story was written with the help of an AI tool. Know more.)
Recommended Articles









Comments (0)
Click the $ button, enter the symbol, and select to link a stock, ETF, or other ticker.