


 Discount


SanDisk Stock Price Forecast: TrendForce Sees 1Q27 NAND Contract Prices Flat to Down 5%, Shares Face About 40% Downside



AI Podcast


On November 20, Eastern Time, SanDisk completed an 8-for-1 stock split to lower the purchase threshold and enhance retail accessibility, though fundamental value remains unchanged. Profitability faces headwinds from declining NAND contract prices and soft demand, with TrendForce forecasting a potential price-cutting cycle by Q2 2027. Technically, the stock exhibits a fully bearish moving average alignment below key resistance at $93.79. If critical support at $85.70 fails, further downside risk extends toward the 1.618 Fibonacci extension level of $54.38, while a recovery depends on reclaiming overhead resistance amid broader industry margin pressures.

TradingKey - On November 20, Eastern Time, SanDisk (SNDK) completed an 8-for-1 stock split of its common stock. According to the company's filing with the U.S. Securities and Exchange Commission, the stock split took effect on November 19, Eastern Time, and the shares are expected to trade on a split-adjusted basis starting at the market open on November 20. The authorized common stock was also increased from 450 million shares to 3.6 billion shares.
The most direct benefit of SanDisk's 8-for-1 stock split is lowering the threshold for purchasing a whole share. Following the split, the reference price per share dropped to one-eighth of its original level. For investors unable to trade fractional shares, the same capital can be deployed across more tranches to build positions and adjust holdings more flexibly, while the lower whole-share price is expected to attract more retail investors.
For existing shareholders, every 1 share becomes 8 shares, with both their ownership percentage and the total value of their holdings remaining unchanged at the time of the split. Therefore, the stock split improves trading convenience rather than automatically making SanDisk's valuation cheaper. What more directly affects profitability remains whether shipment growth and declining unit costs can offset pricing pressure amid falling NAND contract prices.
Research released by TrendForce on November 19 shows that although U.S. cloud service providers raised their demand forecasts for enterprise SSDs for 2027, Chinese cloud service providers—weighed down by GPU supply shortages and elevated inventories—have cut orders by an amount exceeding the new demand from U.S. customers. Meanwhile, consumer electronics manufacturers are also controlling costs by reducing per-device storage capacity.
On the supply side, higher-layer flash memory and QLC technology, which accommodates more data per storage cell, are driving up output. TrendForce forecasts that global NAND flash bit supply will grow by 25% to 30% in 2027; overall contract prices will be flat to down 5% quarter-over-quarter in the first quarter, and all product categories could enter a price-cutting cycle starting in the second quarter.
For SanDisk, if contract prices fall as expected, revenue growth could still slow even as shipment volumes increase. How much gross margin is impacted will depend on whether the speed at which new process technologies reduce unit storage costs can keep pace with falling selling prices.
From a technical perspective, SanDisk's stock price has fallen below the 1.272 Fibonacci extension level ($93.79), with no clear sign of halting the decline in the short term. The $93.79 level serves as the current dividing line between strength and weakness. While previous daily candles saw brief support around this area, the intraday high reached only $90.67 this time, leaving the downward gap unfilled. Whether the stock can reclaim $93.79 by the close will determine whether this pullback is a brief dip or the start of an extended decline.
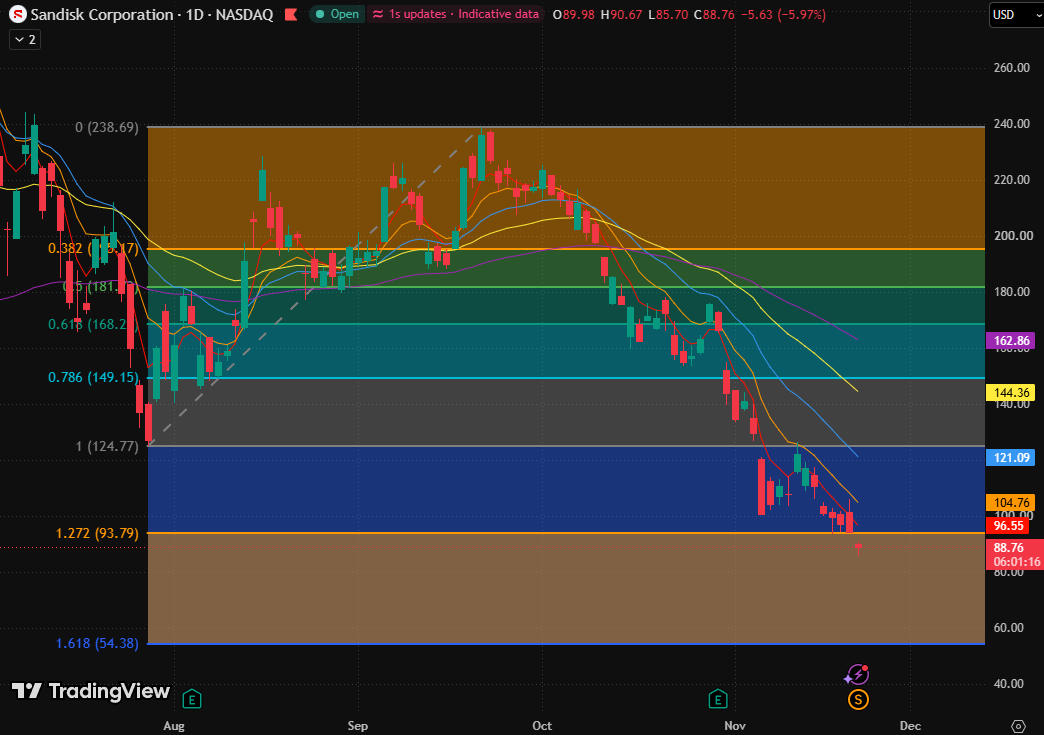
SanDisk stock price chart, Source: TradingView
In terms of moving averages, the 5-day exponential moving average ($96.55), 10-day exponential moving average ($104.76), and 20-day exponential moving average ($121.09) are all trending downward, while the 80-day exponential moving average ($144.36) and 160-day exponential moving average ($162.86) are also falling. The stock price trades below all five moving averages, which maintain a fully bearish alignment. Even if $93.79 is reclaimed, the 5-day exponential moving average directly above remains the first test for a short-term rebound.
Regarding upside potential, the first focus is whether the stock can clear the intraday high ($90.67) and fill the gap. Major overhead resistance levels are, in order, the $93.79–$96.55 range formed by the 1.272 Fibonacci extension and the 5-day exponential moving average, followed by the 10-day exponential moving average ($104.76).
The greatest risk is that after the intraday low ($85.70) is breached, a rebound fails to reclaim it. If subsequent rebounds fail to recover this level, the intraday support will be invalidated, further reinforcing the downward structure. The stock could then fall further toward the 1.618 Fibonacci extension ($54.38) to seek support.
This content was translated using AI and reviewed for clarity. It is for informational purposes only.
Recommended Articles











Comments (0)
Click the $ button, enter the symbol, and select to link a stock, ETF, or other ticker.