


 Discount


Williams-Sonoma Sinks 15% on an Unchanged Outlook, Putting $215.89 Support to the Test



AI Podcast


Williams-Sonoma shares plummeted 15.16% to $220.66 on Thursday, November 19, despite posting solid fiscal third-quarter results with a 5.8% rise in net revenue and an 11.7% increase in non-GAAP EPS. The selloff was triggered by management's decision to merely reiterate its full-year guidance rather than raise it, compounded by warnings regarding surging diesel expenses and a weakening housing market. Technically, the stock breached its rising channel, with crucial support identified at $215.89. A break below this level could drive further declines toward $205.95, while a close above $227.28 is required to signal stabilization.

TradingKey - Williams-Sonoma (NYSE: WSM) fell 15.16% to $220.66 on Thursday, November 19, from $260.09, after reporting fiscal third-quarter results before the open. It opened at $243.19 and slid through the session to a low of $217.11, and overnight trading is nearly flat at $220.88.
The quarter was solid, with every brand growing and EPS rising 12%, but the company only reiterated its full-year outlook and warned about rising diesel costs and a weaker housing market. With the stock just 5.2% below its 52-week high of $274.44 before the report, by my calculation, investors had expected more. It was the worst performer in the S&P 500 on Thursday, according to The Wall Street Republic, and closed at its lowest level since mid-September.
A Solid Quarter on Paper
Net revenue rose 5.8% to $1.99 billion, roughly in line with expectations, and comparable brand revenue, which tracks sales at existing stores and online, grew 5.1%, faster than 4.0% a year earlier. Non-GAAP EPS, which excludes one-time items, rose 11.7% to $2.19, a cent above the $2.18 Zacks consensus. Reported EPS was higher at $2.38 because it included $29.3 million of tariff refunds.
Margins also improved slightly. The non-GAAP gross margin rose 0.1 percentage point to 46.2%, and the non-GAAP operating margin rose 0.4 point to 17.4%. CEO Laura Alber called it "another strong quarter," and business-to-business sales, which include hotel and office projects, grew 15% to a record.
Pottery Barn Is the Weak Spot
Every brand grew, but not equally. West Elm led with comparable growth of 7.0%, up from 3.3% a year earlier, and the Williams Sonoma brand rose 6.8%. Pottery Barn, the biggest brand at about 38% of revenue, grew only 1.8%, and Pottery Barn Kids and Teen slowed to 2.9%.
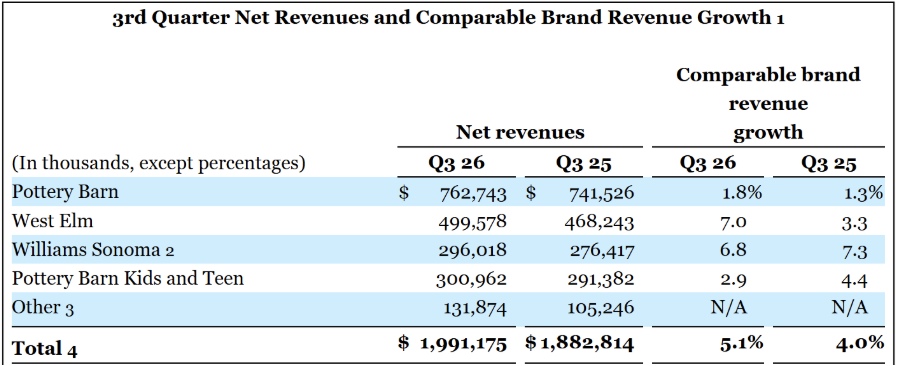
Source: Williams-Sonoma Q3 2026 earnings release, November 19, 2026 (ir.williams-sonomainc.com)
Alber said Pottery Barn's slowdown came mainly from non-furniture products, where the company chose to sell more at full price. It plans to keep markdowns lower in the fourth quarter too, while competitors are discounting heavily, some with about 70% of their products on sale, she said. That protects margins but could cost sales in the holiday season.
Diesel and Housing Cloud the Outlook
The outlook is where investors were disappointed. Williams-Sonoma reiterated, rather than raised, its full-year guidance for revenue growth of 4.7% to 7.2%, comparable growth of 4.0% to 6.5% and a non-GAAP operating margin of 17.8% to 18.2%.
CFO Jeff Howie said diesel prices were up more than 60% from a year earlier in the third quarter and about 20% since August. Diesel took about 0.75 percentage point off margins in the quarter, and the extra cost for the full year "could be as high as $60 million." Guidance assumes oil prices stay at current levels, so any further rise is a risk.
Alber added that the company delivered its results despite "a housing market that has gotten worse," a key concern for furniture sellers, since furniture demand tends to follow home sales. The fourth quarter also laps a shrink benefit of about 1.6 percentage points from last year, meaning fewer lost or damaged goods than expected, which lower tariff costs should largely offset.
Notice what did not happen, though. Williams-Sonoma did not cut its guidance, and no brand posted a decline. TJX, by contrast, rose 8.05% on Wednesday after raising its full-year comparable sales outlook, with HomeGoods growing 5%. This week, the market rewarded higher guidance and punished guidance that stayed the same.
Cash Returns and What Comes Next
The company returned $253 million to shareholders in the quarter, $163 million through buybacks and $90 million in dividends, and has about $900 million left under its buyback program. Its $0.76 quarterly dividend, up 15% this year, now yields about 1.4% at Thursday's close. Inventory rose 7.3% to $1.64 billion, slightly faster than sales, which is worth watching into the holidays. Fiscal 2027 guidance comes in March.
Williams-Sonoma Technical Analysis: Daily Close Below $215.89 Could Open $205.95
The daily chart shows how sharp the reversal was. The stock broke down from the rising channel, two parallel lines that had guided it higher since September, and fell below both moving averages, which track the average price over recent sessions, at $236.39 and $245.69. Buyers stepped in near $217.11, just above the $215.89 pivot, which sits on top of a triple-bottom zone from August and September, an area where the stock found a floor three times. That makes it a critical support.
RSI, a momentum gauge that runs from 0 to 100, has dropped to about 35. The MACD, another momentum indicator, has crossed lower, which confirms that momentum has shifted to sellers.
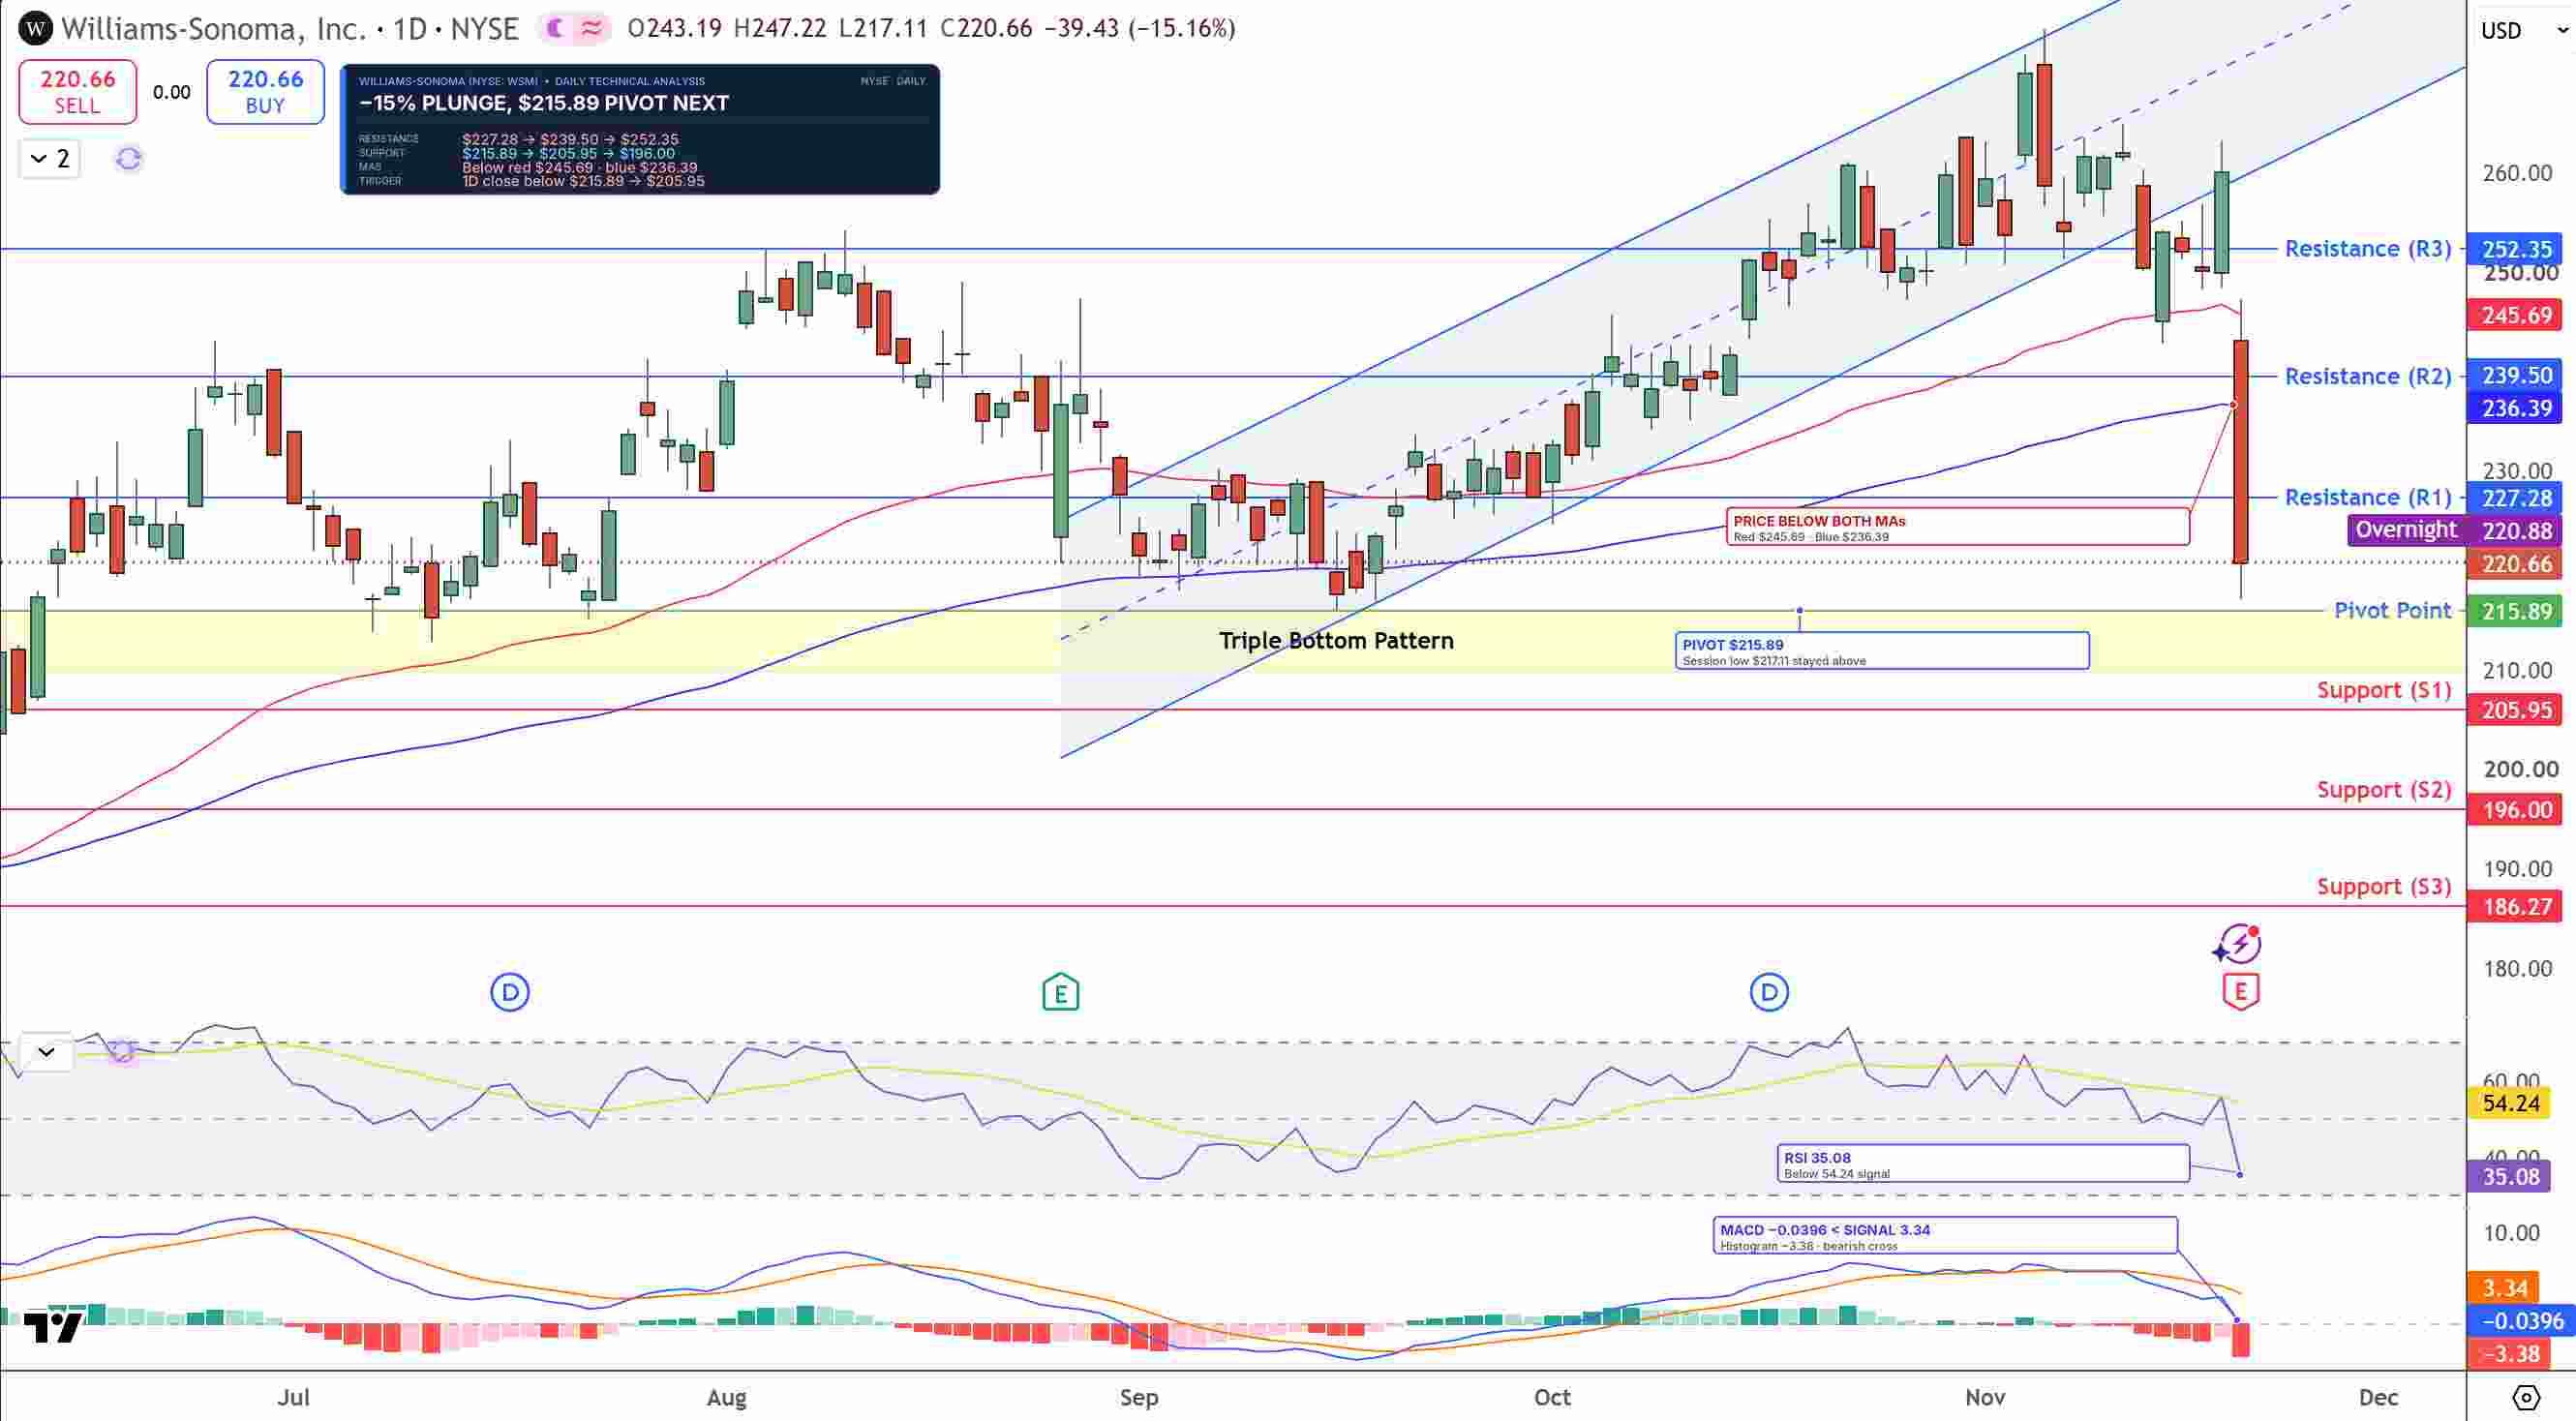
WSM Price Chart - Source: Tradingview
A daily close below $215.89 could send the stock toward $205.95, followed by $196.00. For buyers, a daily close back above $227.28 would be the first sign of relief.
I'm bearish while Williams-Sonoma stays below $227.28, with $215.89 as the key support.
Key Levels
- Last close: $220.66, down 15.16% on Thursday, November 19 (overnight: $220.88)
- Support: $215.89, $205.95, $196.00
- Resistance: $227.28, $236.39, $245.69
- RSI: 35.08
- Bullish trigger: Daily close above $227.28
- Bearish trigger: Daily close below $215.89
FAQs
Why did Williams-Sonoma stock fall 15%?
Williams-Sonoma reported 5.1% comparable growth and EPS of $2.19, a cent above estimates, but only reiterated its full-year outlook while warning that diesel costs were up more than 60% and that the housing market has gotten worse. Investors had expected a guidance raise.
What is the Williams-Sonoma stock forecast now?
The bias is bearish while WSM stays below $227.28. A daily close below $215.89 could send the stock toward $205.95 and $196.00, while a daily close above $227.28 would be the first sign of relief.
Bottom Line
Williams-Sonoma delivered growth across every brand, but an unchanged outlook, rising diesel costs and a weaker housing market turned a solid quarter into a 15% drop. The level that matters is $215.89. In my view, a daily close below it would break the triple-bottom floor and open $205.95, while a move back above $227.28 would suggest the selloff went too far.
Recommended Articles









Comments (0)
Click the $ button, enter the symbol, and select to link a stock, ETF, or other ticker.