


Microsoft Pulls Back 8% From Record High as Technicals Warn of Over 10% Further Downside



AI Podcast


Microsoft shares have pulled back 8% from their November 4, 2026 all-time high, facing headwinds from Anthropic’s competing AI spreadsheet tool and hawkish Federal Reserve signals regarding higher interest rates. Elevated capital expenditures for AI infrastructure and slowing Copilot monetization pace further weigh on investor sentiment. Technically, the stock has broken below its 50-day and 200-day moving averages, signaling weakened bullish momentum. If the $500 psychological support fails amid broader tech deleveraging, the stock faces a potential risk of sliding more than 11% toward the $460–$480 range due to thin volume support below.

TradingKey - Microsoft (MSFT) has pulled back 8% from its all-time high, yet the selloff is not over, with technical red flags warning of a potential ruthless drop of more than 10%.
In Eastern Time, Microsoft (MSFT) shares rose intraday before retreating to close up 0.36%; they continued to soften in after-hours trading, falling 0.3% to trade at $520.8. Since setting an all-time high of $559.15 on November 4, 2026, Microsoft (MSFT) shares have pulled back significantly in just a few trading sessions, dipping intraday into the $518–$520 range, with the maximum drawdown from its all-time high approaching 7% to 8%.
Microsoft's intraday reversal was mainly driven by two external headwinds. On November 10, key competitor Anthropic officially launched Claude Sheets for enterprise workplace scenarios, an AI spreadsheet tool seen by the market as directly targeting Microsoft's core cash cow, Excel. Concerns mounted that Microsoft faces not only in-house development by customers and competition in cloud computing power, but also direct market-share encroachment on its most entrenched productivity software (Microsoft 365) by AI-native applications, triggering a 2.20% drop in its stock on heavy volume that day.
On the same day, the U.S. released October CPI data that exceeded expectations, while Federal Reserve (Fed) officials delivered a flurry of hawkish signals indicating they could not rule out resuming interest rate hikes in December, pushing U.S. Treasury yields sharply higher. Amid expectations of higher-for-longer interest rates, Microsoft—boasting a market capitalization of nearly $3.9 trillion and a P/E ratio of about 27 times—became a prime target for institutions seeking to take profits and reduce tech exposure.
Although Microsoft posted stellar Azure cloud revenue last quarter, with commercial remaining performance obligations (RPO) reaching $678 billion, Wall Street remains concerned about its continuously surging capital expenditures to support AI infrastructure. The market is rigorously scrutinizing whether the monetization pace of Copilot is sufficient to cover massive depreciation costs, leaving its share price susceptible to further downward pressure.
Currently, multiple daily technical indicators show that Microsoft's short-term bullish momentum has weakened significantly, with structural breakdown signals even emerging. Having consecutively fallen below its 50-day moving average (around $534.98) and its 200-day moving average (around $531.50), the former support zone has flipped into heavy overhead resistance, potentially sending the stock to test the $500 psychological barrier coupled with the pullback lows of late October in the short term.
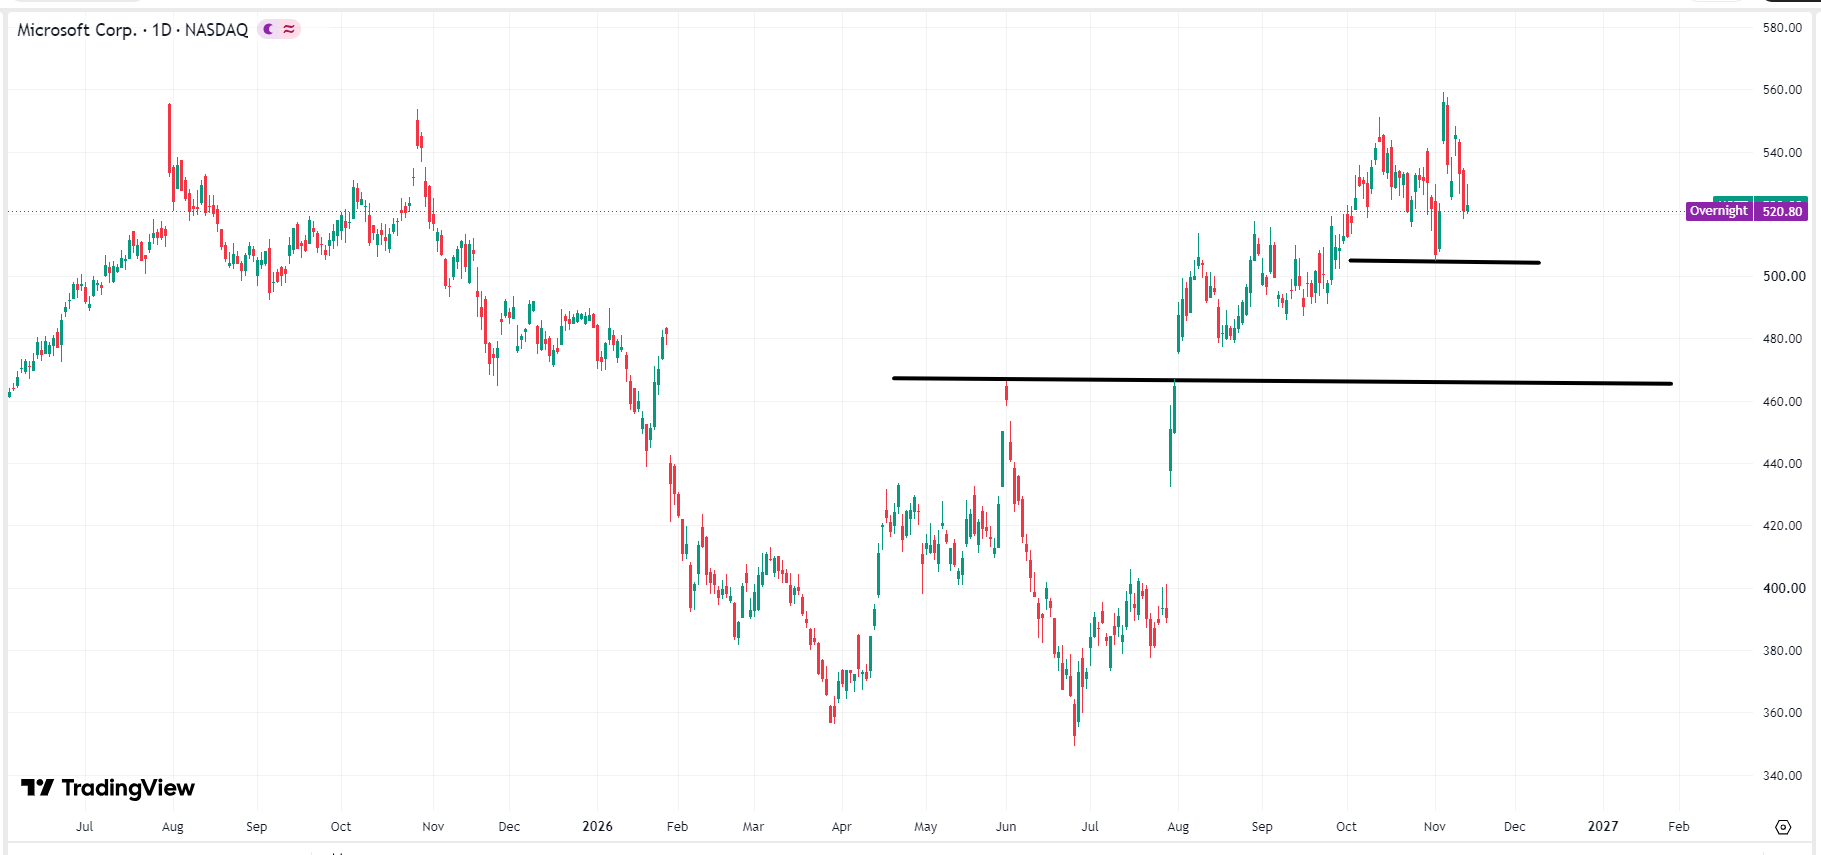 Microsoft stock price chart, Source: TradingView
If the Federal Reserve (Fed) maintains its high-interest-rate stance or the tech sector undergoes collective deleveraging, causing the daily candlestick body to break below $500 on heavy volume, there is virtually no substantive volume concentration zone below until the $460–$480 range. The stock would then face the risk of a swift downward slide to fill the gap left from August 3, meaning that under extreme conditions, it could fall by more than approximately 11% from current levels.
This content was translated using AI and reviewed for clarity. It is for informational purposes only.
Recommended Articles











Comments (0)
Click the $ button, enter the symbol, and select to link a stock, ETF, or other ticker.