


Rocket Lab Plunges Over 6% as Record Revenue Fails to Mask Profit Decline, Faces Further 30% Drop



AI Podcast


Rocket Lab reported a record Q3 revenue of $268 million on November 9, 2026, ET, yet its shares tumbled over 6% after-market as wider-than-expected losses of $0.12 per share disappointed investors. Elevated R&D and operating expenses pressured its high valuation multiple, raising technical risks of a 25%–30% pullback toward the $38–$42 range. Despite near-term downward pressure, the company’s $3.6 billion backlog and strong Space Systems segment preserve a solid fundamental moat. Analysts suggest extreme pullbacks could present attractive entry opportunities for long-term investors anticipating the 2027 Neutron maiden flight.
TradingKey - Rocket Lab missed earnings expectations, sending its shares tumbling over 6%, with technical analysis warning of a potential 30% further downside risk.
After market close on November 9, 2026, ET, Rocket Lab (RKLB) reported its third-quarter (Q3) financial results after the bell. Although quarterly revenue hit another record high, weighed down by surging R&D expenses and operating costs, the company's loss widened further, sending RKLB shares tumbling over 6% post-market.
According to the released financial report, Rocket Lab's Q3 revenue reached $268 million, exceeding market expectations of $257 million–$265 million and setting a record quarterly revenue high for six consecutive quarters. However, GAAP loss per share (EPS) was $0.12, wider than the $0.07 expected by analysts and significantly expanding from a loss of $0.03 in the same period of 2025.
Prior to the earnings release, Rocket Lab's stock traded at a price-to-sales ratio as high as approximately 30 to 38 times. The valuation of such high-growth tech stocks is heavily reliant on the timeline for narrowing losses and achieving positive cash flow. When loss per share significantly misses expectations and losses widen year-over-year, high valuation multiples inevitably face downward revisions.
If short-term risk-off sentiment and the valuation correction continue to play out, with strong technical overhead resistance forming at $58–$60, the stock price could test the $38–$42 range further, approaching its 52-week low of $37.57, representing a potential pullback of approximately 25%–30% from pre-earnings levels.
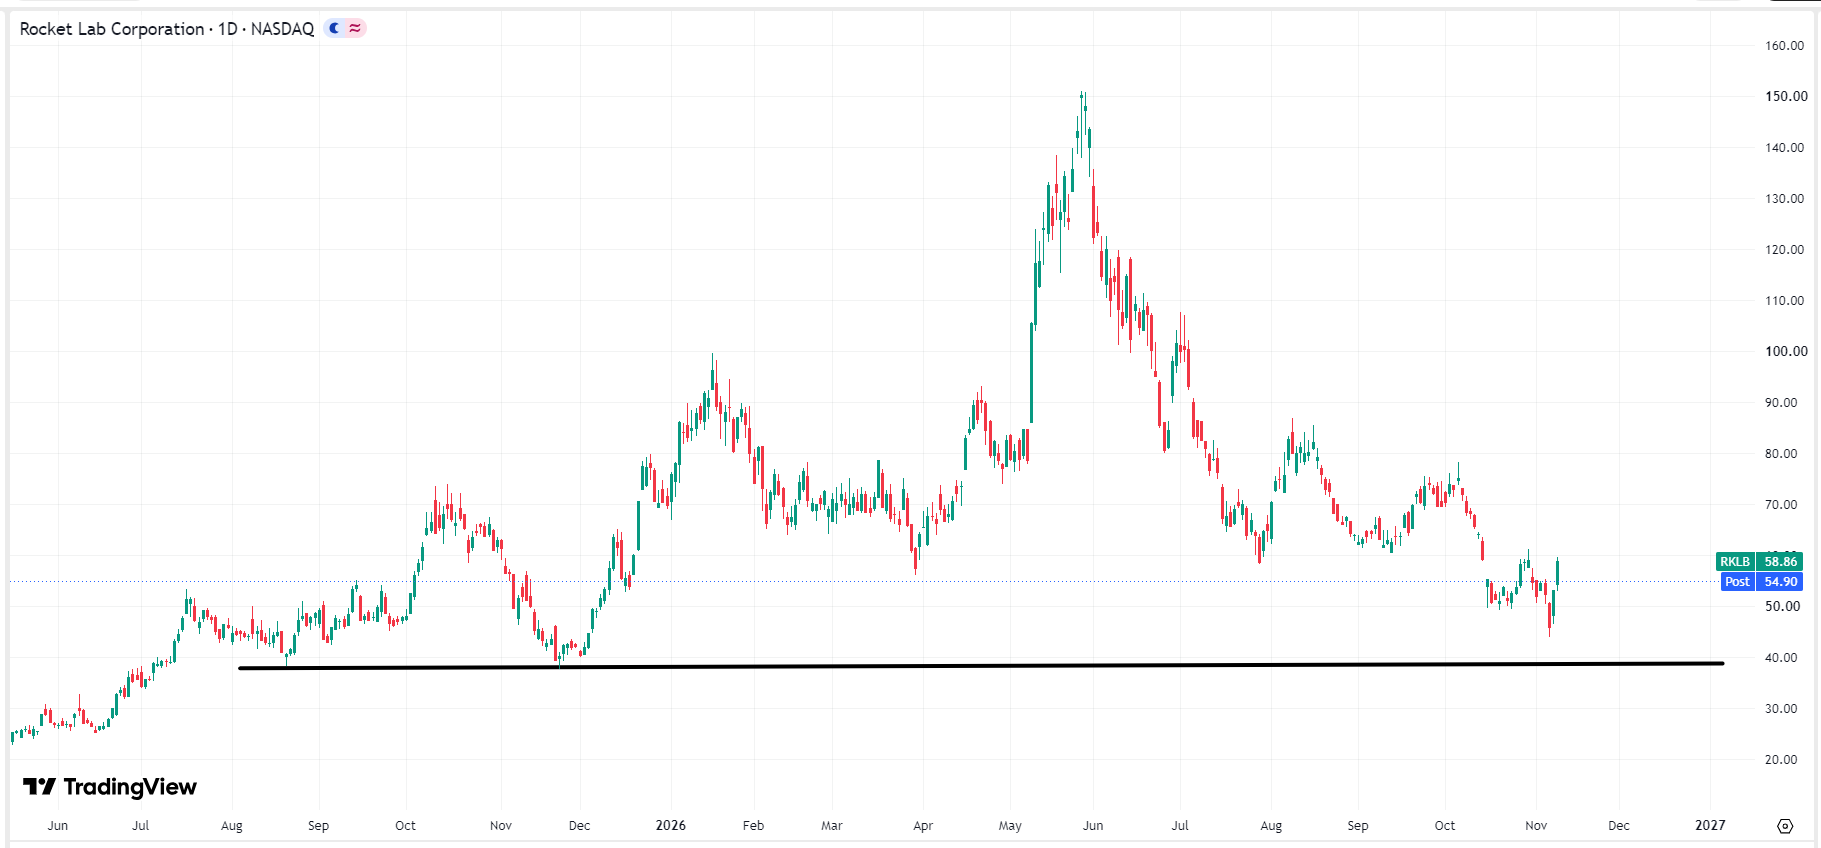 Rocket Lab stock price chart, Source: TradingView
As the world's leading private aerospace company with the highest commercial launch success rate outside of SpaceX, Rocket Lab's $3.6 billion backlog and high-growth Space Systems business provide a solid fundamental moat, making it less likely for its stock price to break below $38. Therefore, if an excessive market liquidation pulls the stock back near this level, it will offer a prime dollar-cost averaging entry point for investors bullish on the 2027 maiden flight of Neutron and the long-term vision of the space economy.
This content was translated using AI and reviewed for clarity. It is for informational purposes only.
Recommended Articles









Comments (0)
Click the $ button, enter the symbol, and select to link a stock, ETF, or other ticker.