


Can Occidental Reach $10 Billion in Debt? OXY Faces $58.16 Resistance Ahead of Earnings



AI Podcast


Occidental Petroleum faces a critical test in its upcoming third-quarter earnings regarding debt reduction progress following the OxyChem asset sale. With third-quarter realized oil prices dropping 11.2%, investors must evaluate whether operating cash flow and sustaining capital efficiency can maintain production without asset divestitures. Technically, OXY remains bearish below immediate resistance at $58.16, with daily RSI at 33.51 approaching oversold levels and downside support eyed at $54.67. Management's long-term strategy targets lower decline rates to boost free cash flow, though near-term debt milestones and volatile commodity prices remain key risk factors.
TradingKey - Occidental Petroleum (NYSE: OXY) closed November 6 at $56.38, up two cents. When Occidental reports after the November 9 close, I’ll look first at how much cash its oilfields generated toward the $1.8 billion that separated it from its debt target at June 30. The stock has its own hurdle at $58.16, where buyers recently lost support.
Selling OxyChem gave Occidental a large, one-time source of cash. The harder part is paying down the remaining debt while funding the wells needed to keep production steady. Occidental received $85.91 a barrel for its oil in the third quarter, down 11.2% from $96.78 in the second quarter. The earnings report will show how much cash the company generated at that lower price.
What Paid for the First $8.6 Billion of Debt Reduction?
Occidental completed the OxyChem sale on January 2 at an adjusted price of approximately $9.5 billion. Sale proceeds and operating cash helped fund $8.6 billion of principal repayments in the first half. That timetable matters when judging the speed of the turnaround. Extrapolating six months of repayments would assume Occidental could sell the same business twice.
The second-quarter update put principal debt at $11.8 billion after a $1.9 billion reduction. Another cut of that size would clear management’s $10 billion milestone. A lower interest bill would benefit common shareholders, but the chemicals business has left the portfolio. Cash from continuing operations is the relevant comparison for what comes next.
How $5.1 Billion of Operating Cash Became $3 Billion
Occidental reported $5.1 billion of second-quarter operating cash flow from continuing operations. Before changes in working capital, the figure was $4.6 billion. Deduct $1.6 billion of capital spending from that second figure and the result is the $3 billion of free cash flow before working capital that management highlighted.
The roughly $500 million difference is worth tracking. Customer collections and the timing of payments to suppliers can lift cash in one quarter and absorb it in the next. Reported diluted earnings were $2.75 per share, against adjusted earnings from continuing operations of $2.40. Neither measure tells shareholders how much cash was available for debt repayment after reinvestment.
The Price Occidental Received for Its Barrels
Occidental produced 1.433 million barrels of oil equivalent per day in the second quarter, above the top of guidance. The Permian Basin and offshore Gulf operations led the outperformance. But the biggest reason upstream earnings rose sequentially was the price Occidental received for crude. Its worldwide average rose 38% from the first quarter to $96.78 a barrel in the second, while domestic natural gas realizations averaged negative $1.48 per thousand cubic feet.
Oil fell on November 9 as President Donald Trump played down the likelihood of renewed U.S. strikes on Iran while negotiations continued. Attacks on shipping near the Strait of Hormuz kept supply risks in view. Those developments matter for the next few quarters. They occurred after September and cannot explain the third-quarter earnings Occidental is about to release.
Why Slower Well Declines Could Protect Cash Flow
As existing wells age, their output falls. A producer has to spend money replacing those lost barrels just to keep total production flat. On the August earnings call, management outlined plans to lower Occidental’s production decline rate from about 25% to 20% by 2030. Better recovery from producing fields is one way it expects to get there.
Management targets $900 million less in annual sustaining capital as part of a wider plan for roughly $4 billion in additional annual cash flow by 2030 relative to 2025. I would look for two things together in the next update: steady production and less spending to sustain it. Cutting drilling briefly can flatter cash flow before the lost barrels show up.
The Dividend and the Next Capital Decision
Occidental declared a $0.28 quarterly common dividend payable January 15 to shareholders of record December 10. On the November 10 call at 1 p.m. Eastern, listen for what management would do with the next dollar of surplus cash once debt reaches its milestone. A dividend is easier to sustain when the fields can fund it through a weaker oil market.
OXY Technical Analysis: Former Support at $58.16 Caps the Rebound
Friday’s $56.38 close left Occidental below the rising trendline connecting the July and late-September lows. What catches my attention is the loss of horizontal support at $58.16 alongside that trendline break. Buyers now have two barriers to clear. A return to $58.16 followed by a weak close would tell me sellers are still using rebounds to exit.
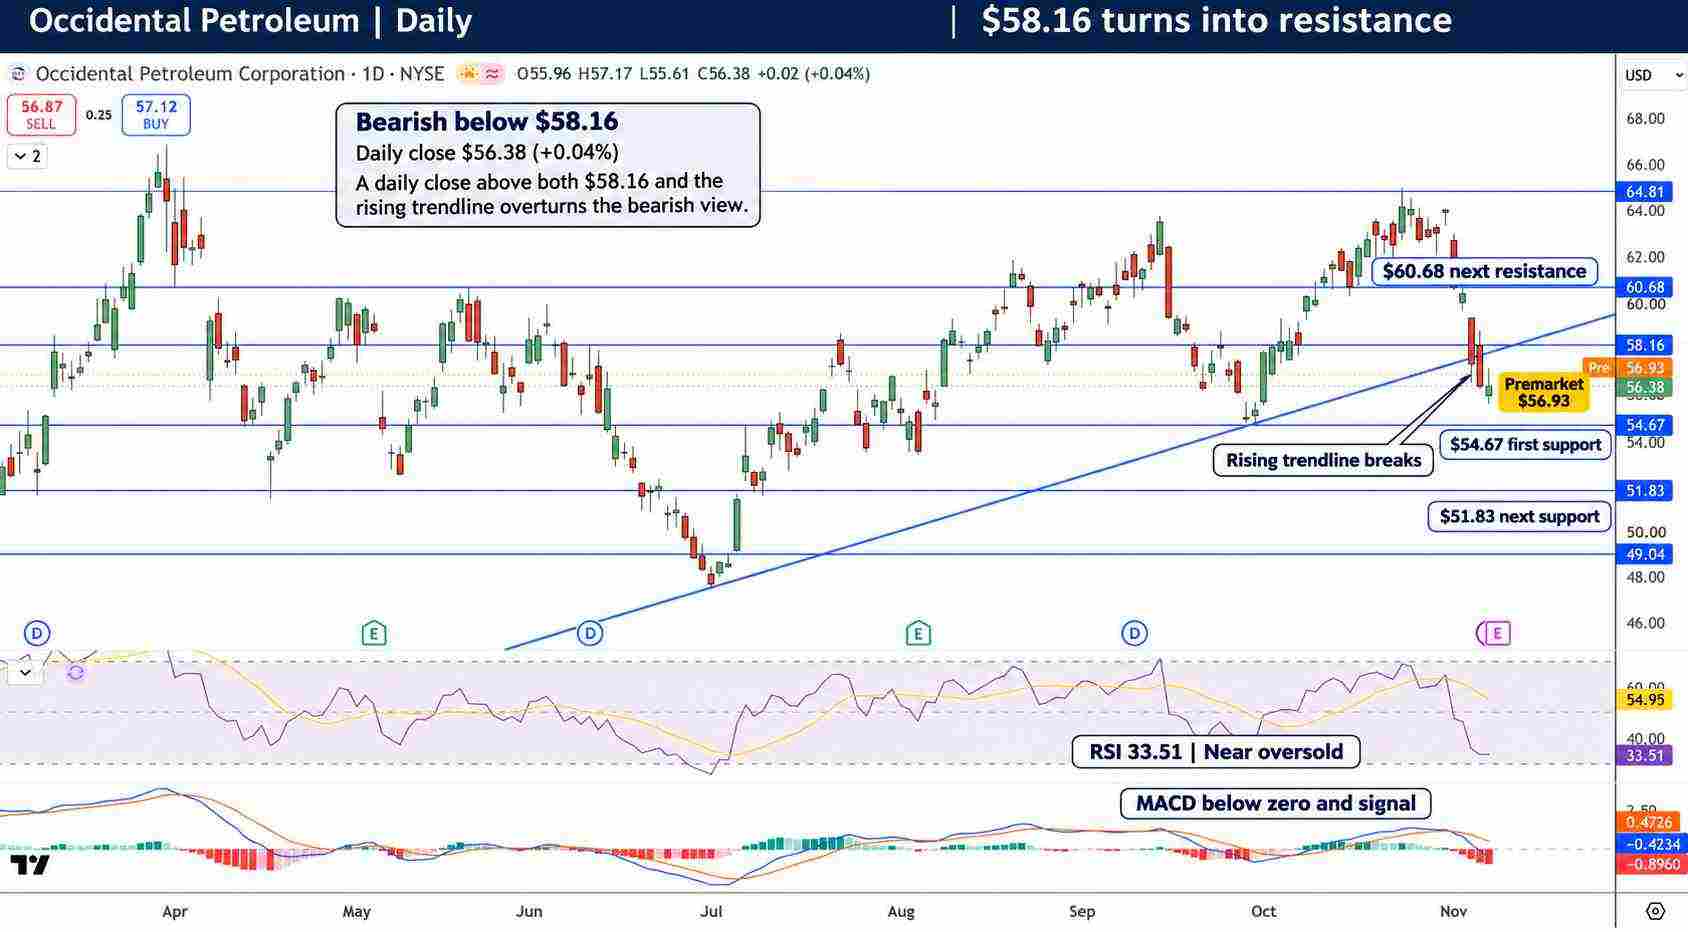
Occidental Price Chart - Source: Tradingview
I remain bearish while that resistance holds. Daily RSI at 33.51 is approaching oversold territory, so a bounce into earnings would be plausible. MACD is below zero and falling further beneath its signal line, which gives me little reason to call a bottom here. My first downside level is $54.67, where buyers stepped in late in September. A daily close below it would expose $51.83. In the other direction, I would need a regular-session close above both $58.16 and the broken trendline to overturn the bearish view. That would put $60.68 back in reach.
Key Levels
- Latest completed close: $56.38 on November 6
- Immediate resistance: $58.16 and the broken trendline
- Upside target: $60.68
- Immediate support: $54.67
- Downside target: $51.83
- Daily RSI: 33.51, approaching oversold
FAQ
When does Occidental report third-quarter earnings?
Results are scheduled after the November 9 U.S. close. Management discusses them on November 10 at 1 p.m. Eastern.
How close was Occidental to its debt target?
Principal debt stood $1.8 billion above the $10 billion milestone at June 30. The third-quarter balance will show how much of that gap Occidental closed.
Bottom Line
Occidental’s lower debt strengthens the equity case. What would make me more constructive is evidence that its fields can hold output with less capital as oil prices fluctuate. On the chart, I stay bearish until OXY closes above both $58.16 and the former trendline.
Recommended Articles









Comments (0)
Click the $ button, enter the symbol, and select to link a stock, ETF, or other ticker.