


Intel Stock Falls Over 50% in Past Two Months, $50 Support in Focus for Potential Rebound Toward $80



AI Podcast


As of November 6 Eastern Time, Intel rose 7.71% to $56.28, yet remains in a post-earnings adjustment phase after a cumulative two-month pullback exceeding 50%. Weak Q4 guidance, persistent PC market headwinds, and a $600 million revenue hit from its Israeli plant weigh on sentiment. Technical indicators show the RSI entering oversold territory at 25.8, sparking a short-term rebound. Key support sits at $50; breaching this level risks a slide toward $45, while stabilization could target the $80 to $85 resistance band.
TradingKey - As of the close on November 6 Eastern Time, Intel (INTC) rose 7.71% to $56.28, hitting an intraday high of $57.32 with a trading volume of approximately 174 million shares. However, calculated from the closing price of $127.39 on September 24, Intel shares have still pulled back more than 50% cumulatively over the past two months, and the overall recent trend remains in a post-earnings adjustment phase.
Intel's recent downturn is primarily tied to its post-earnings financial guidance. The company expects fourth-quarter revenue of $15 billion to $16 billion, below analysts' estimates of about $17.07 billion, while its adjusted EPS guidance of $0.25 also fell short of the market consensus of approximately $0.44. At the same time, management expects weakness in the PC market could persist into the first half of 2027, and an incident at its Kiryat Gat plant in Israel is expected to reduce revenue by about $600 million over two quarters while impacting server chip supply and gross margins.
In addition, the AI and semiconductor sectors experienced a broad pullback in early November. The market reassessed returns on AI infrastructure capital expenditures, while expectations for data center regulation following the U.S. midterm elections also triggered a consolidation in tech stocks. On November 5, INTC dropped another 10.33% to $52.25, before recouping part of its losses on November 6 alongside a rebound in the semiconductor sector.
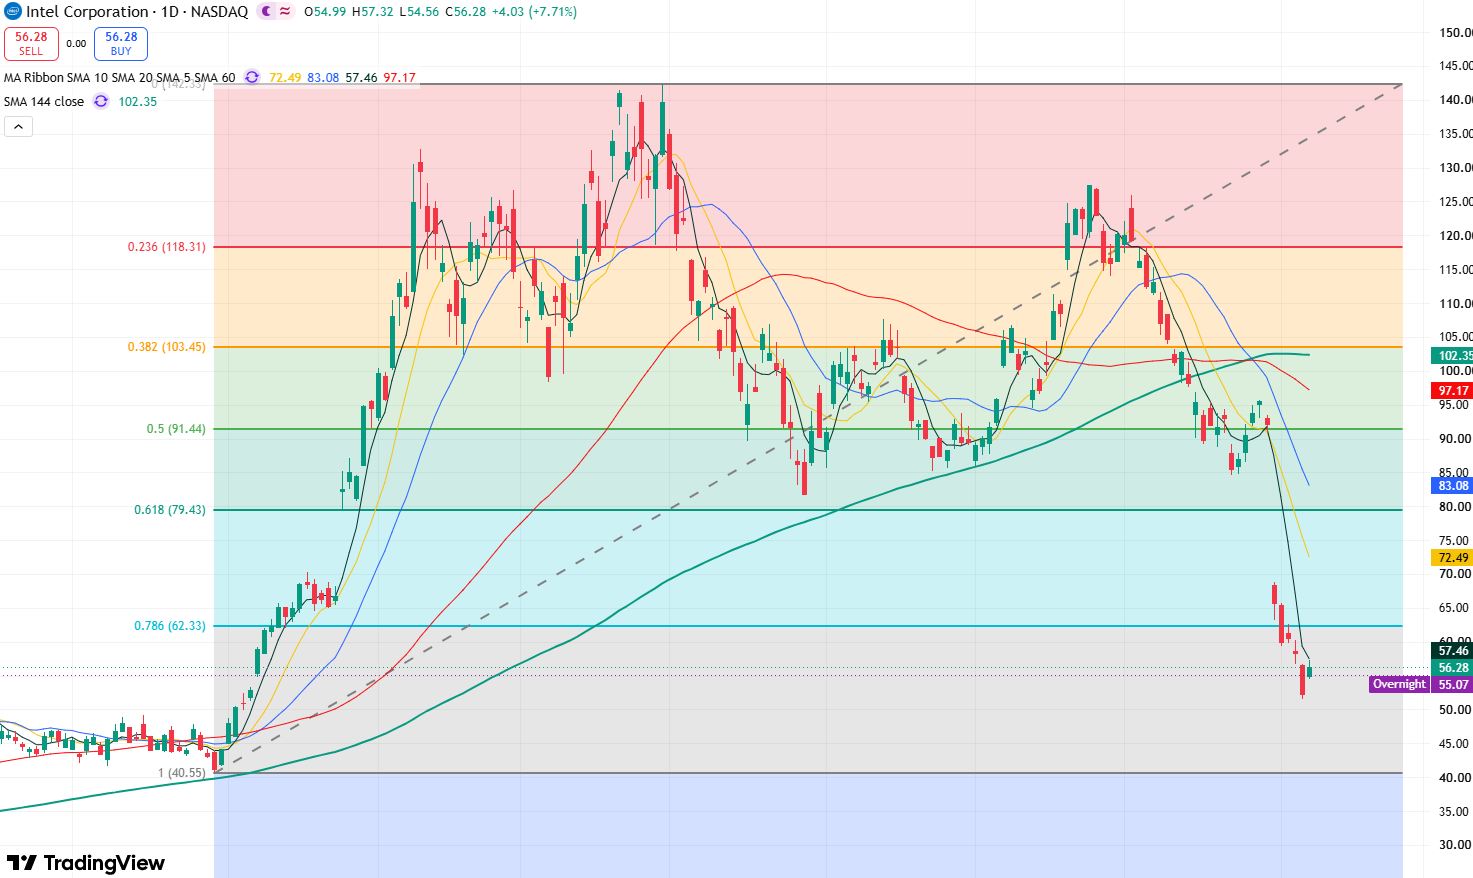
Intel stock daily chart, Source: TradingView
From Intel's daily chart, the stock tumbled more than 28% on October 30 due to its earnings report, breaking directly below the July 29 level of $81.79 and the $80 mark. This triggered a surge in market bearishness, driving the stock down for five consecutive trading sessions post-earnings. After briefly finding support as it dropped to $51.51 last Thursday, the stock staged a strong rebound of nearly 8% on Friday, showing some recovery in bullish market sentiment.
In terms of technical indicators, the Relative Strength Index (RSI) stands around 25.8, entering oversold territory, which points to an increasing likelihood of an oversold technical rebound. However, the stock remains capped below its 5-day moving average, indicating that the short-term bounce has not yet reversed the downtrend.
Currently, the key downside support level to watch is $50, which serves as significant platform support on the weekly chart. If this level is breached, the stock could slide further toward around $45, corresponding to the 144-week moving average. Conversely, if the stock shows signs of stabilizing above $50, it will initiate a technical corrective rebound, with the primary upside target testing the resistance band between $80 and $85.
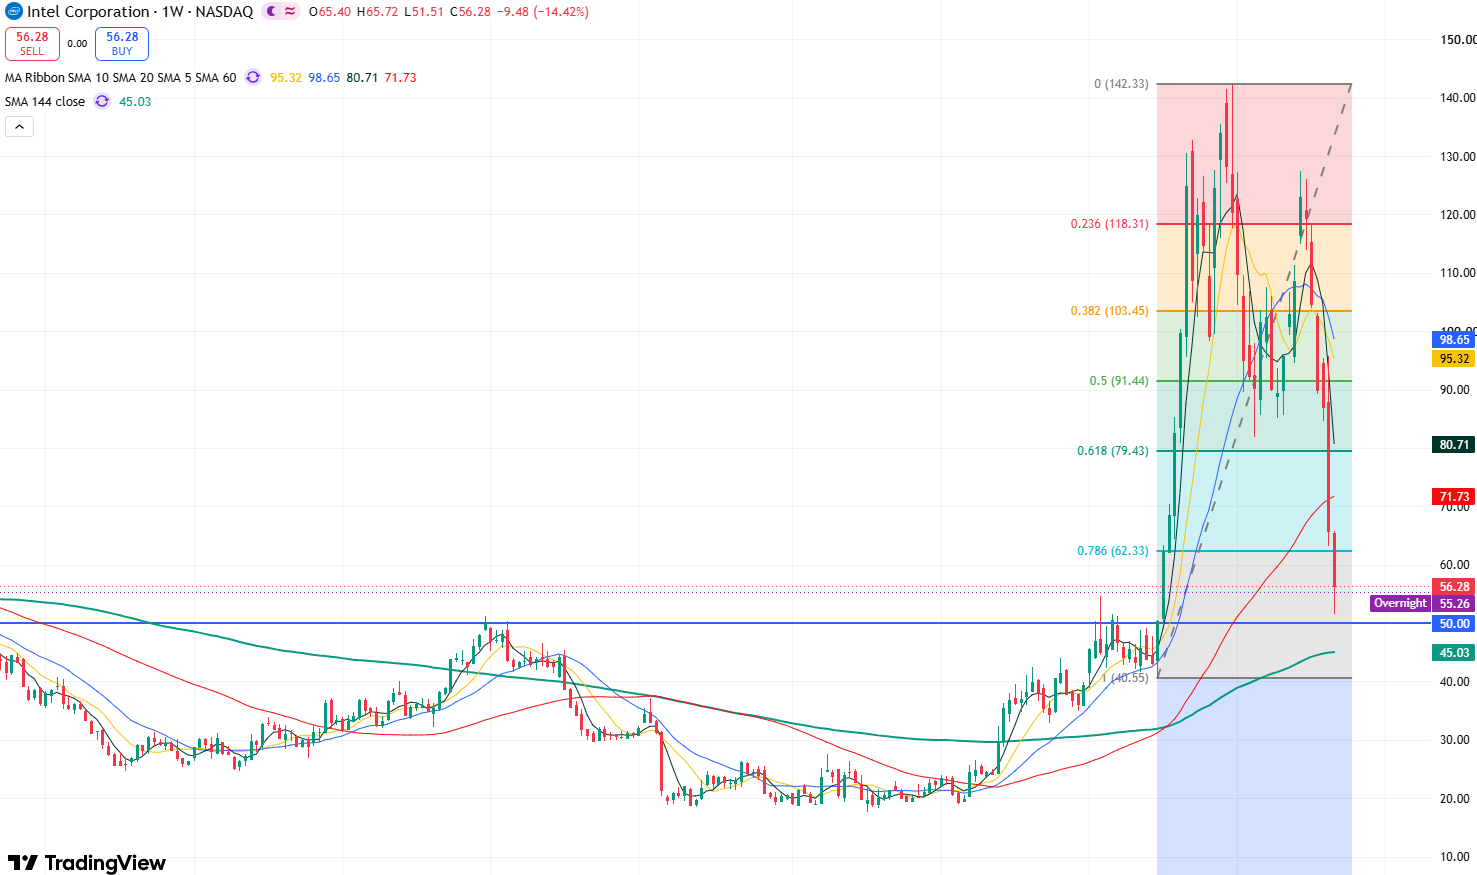
Intel stock weekly chart, Source: TradingView
This content was translated using AI and reviewed for clarity. It is for informational purposes only.
Recommended Articles










Comments (0)
Click the $ button, enter the symbol, and select to link a stock, ETF, or other ticker.