


Apple Stock Price Forecast: $7 Billion Investment-Grade Bond Sale Draws Strong 4.4x Demand, Shares May Hit Record High of $372



AI Podcast


On November 5, Eastern Time, Apple plans to issue approximately $7 billion in investment-grade bonds across seven tranches, attracting $31 billion in orders. Unlike peers issuing debt for AI infrastructure, Apple focuses proceeds on general corporate purposes, including share repurchases and dividends, appealing to investors amid tech financing scrutiny. Technically, Apple tests its prior high within an upward structure. While short-term moving averages maintain a bullish alignment, the price sits below the previous high of $344.57. Key overhead resistance ranges from $355.38 to $356.69, with critical support located at the $341.95 to $343.20 moving average cluster.

TradingKey - On November 5, Eastern Time, Bloomberg reported, citing people familiar with the matter, that Apple (AAPL) plans to issue approximately $7 billion in investment-grade bonds and has attracted about $31 billion in subscription orders, equivalent to 4.4 times the planned offering size. Strong demand drove spreads narrower, showing that Apple remains favored by bond investors amid rising concerns over AI financing.
This marks Apple's first return to the bond market since raising $4.5 billion in May 2025. The transaction is divided into seven tranches with maturities ranging from two to ten years, and the final size may still be adjusted based on demand. Proceeds will be used for general corporate purposes, including share repurchases, dividend payments, and capital expenditures.
This marks Apple's first return to the bond market since raising $4.5 billion in May 2025. The transaction is divided into seven tranches with maturities ranging from two to ten years, and the final size may still be adjusted based on demand. Proceeds will be used for general corporate purposes, including share repurchases, dividend payments, and capital expenditures.
The use of proceeds is an important distinction in this round of issuance. The aforementioned three companies issued a combined $50 billion in bonds in the U.S. over the past few days, primarily to support AI infrastructure investments. As investors increasingly focus on when massive outlays will translate into profits, the related bonds need to offer a higher risk premium.
Bloomberg Intelligence analyst Robert Schiffman noted that Apple's bond offering is more about capitalizing on favorable market conditions to fund share repurchases and dividends. Compared to the massive AI infrastructure spending by hyperscale cloud providers, Apple places greater emphasis on shareholder returns in its capital allocation.
For Apple, lower offering spreads help contain borrowing costs and replenish funds needed for repurchases and dividends. While share buybacks reduce share capital to support earnings per share, the additional interest expense will partially offset those gains. This issuance reflects that investors, when taking on tech company debt, are evaluating the use of proceeds, capital expenditure intensity, and cash returns in greater detail.
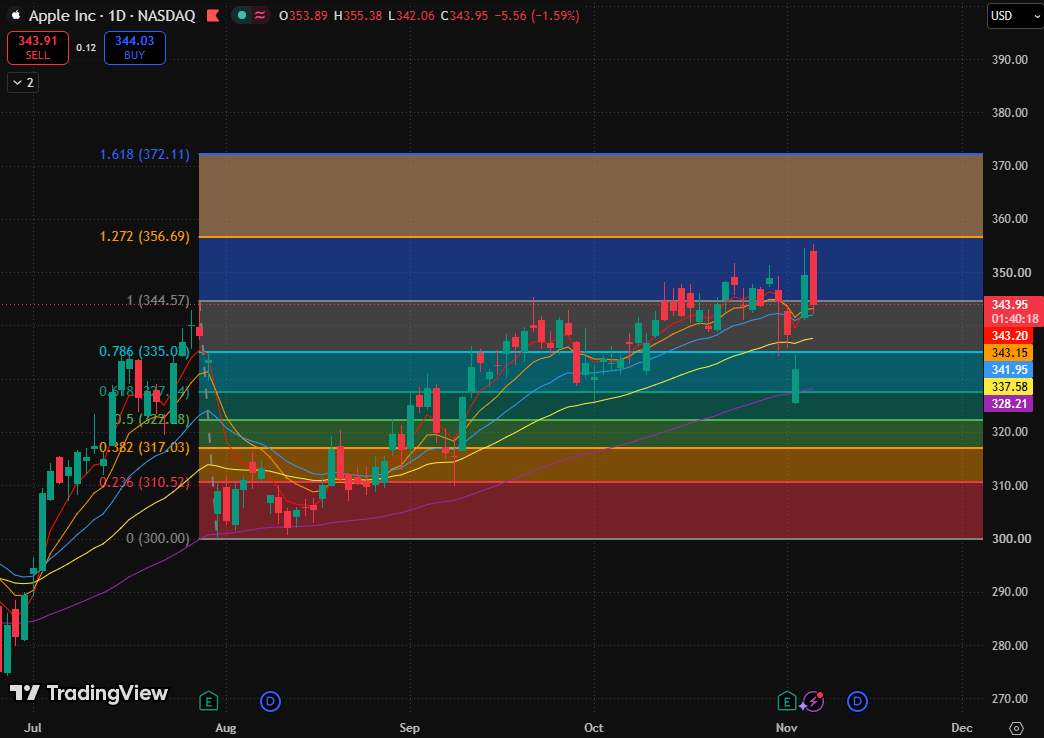
Apple Stock Chart, Source: TradingView
From a technical perspective, Apple is currently in a phase of testing its prior high within an upward structure. After an intraday surge, the price fell back below its previous high ($344.57), indicating that the breakout has not yet converted into stable support; however, the price remains above the dense cluster of short-term moving averages, and the medium-term upward structure has not yet been disrupted.
Regarding moving averages, the five moving averages decrease in sequence from shorter to longer cycles, maintaining a bullish alignment; however, the spread among short-term moving averages has narrowed, and their support is undergoing a pullback test.
Key overhead resistance lies in the $355.38–$356.69 zone, which sits adjacent to recent highs and the 1.272 Fibonacci extension level. If the stock price successfully holds above this price range, it is expected to break out to a new all-time high toward $372.
If it closes below the $341.95–$343.20 moving average cluster and fails to reclaim it on a rebound, the short-term structure will weaken, and pressure to fill the recent recovery gap will increase.
This content was translated using AI and reviewed for clarity. It is for informational purposes only.
Recommended Articles










Comments (0)
Click the $ button, enter the symbol, and select to link a stock, ETF, or other ticker.