


AppLovin Stock Price Forecast: Surges Over 20% Past $320 After Earnings, AI Advertising Strength May Push Stock Toward $400



AI Podcast


AppLovin reported third-quarter 2026 financial results, with revenue surging 55% year-over-year to $2.185 billion and diluted EPS reaching $4.30, both beating expectations. Robust profitability, driven by its Axon AI advertising technology, and strong fourth-quarter guidance exceeding Wall Street forecasts fueled a sharp post-earnings stock surge. The company also announced an additional $3.2 billion share repurchase authorization. Technically, the stock rebounded from oversold levels, breaking key resistance to target $400. However, investors should monitor execution risks regarding e-commerce expansion and potential pullbacks if primary support levels are breached.
TradingKey - After the market close on November 4, Eastern Time, AppLovin (APP) reported its third-quarter 2026 financial results, with both revenue and EPS beating expectations and fourth-quarter guidance also topping market forecasts, driving its stock up more than 20% in post-market trading.
In pre-market trading on November 5, AppLovin was up 15.92% at $315 as of press time.
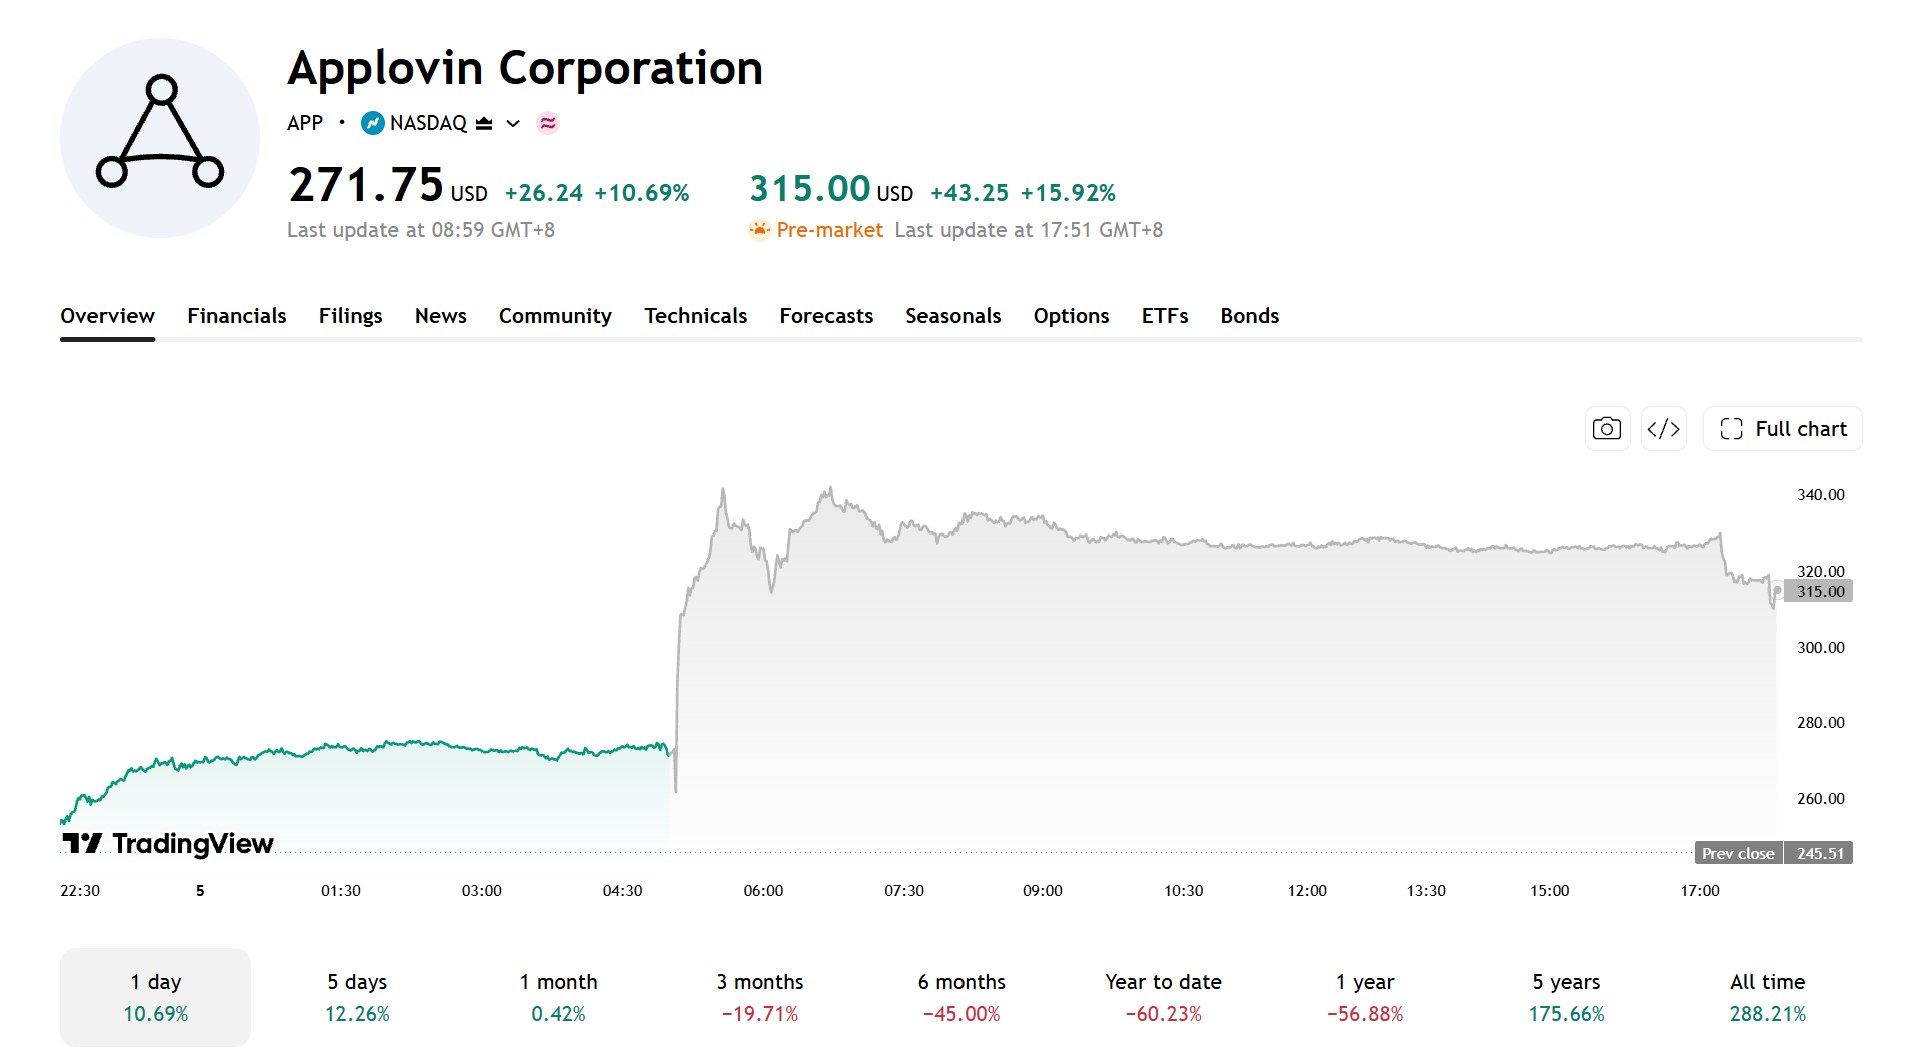
[Source: TradingView]
In the third quarter, the company's revenue increased 55% year-over-year to $2.185 billion, and diluted earnings per share reached $4.30, both exceeding market expectations. The company expects fourth-quarter revenue of $2.365 billion to $2.395 billion, higher than Wall Street expectations of approximately $2.25 billion.
Both results and guidance beat expectations, boosting market confidence in the company's earnings growth. Looking ahead, the market will focus on AI advertising technology upgrades, the expansion of its e-commerce advertising business, and the impact of the newly added $3.2 billion share repurchase authorization on the stock price.
Q3 Revenue Rises 55% as Profit and Cash Flow Improve in Tandem
In the third quarter, AppLovin's net income reached $1.439 billion, up 72% year over year; adjusted EBITDA was $1.842 billion, up 59% year over year, with a margin of approximately 84%; and free cash flow was $1.418 billion.
Simultaneous growth in revenue, profit, and cash flow indicates that the company's advertising platform continues to possess strong profitability.
For the fourth quarter, the company expects revenue to reach $2.365 billion to $2.395 billion. Based on the midpoint of the guidance, quarterly revenue will continue to grow sequentially, indicating that management expects advertising demand to remain strong.
The company's board of directors also authorized an additional $3.2 billion in share repurchases, bringing the total buyback authorization to $3.6 billion. Share buybacks can reduce the number of shares outstanding, but the ultimate impact will still depend on the scale of execution and repurchase prices.
Axon AI and E-Commerce Advertising Expand Growth Potential
AppLovin connects advertisers with mobile app developers through its advertising technology platform. Its core product, Axon, leverages AI and machine learning to optimize ad matching and delivery, improving ad conversion efficiency.
In the third quarter, the company's revenue grew 55% year-over-year, primarily driven by improved ad monetization efficiency, with net revenue per install increasing 55% year-over-year and install volume rising 2%.
In addition, the company is expanding its advertising business into non-gaming sectors such as e-commerce to broaden its client base and reduce reliance on mobile gaming advertising, though the revenue contribution from these businesses remains to be verified in subsequent earnings reports.
APP Technical Analysis: Rebound Trend Forms, Next Target Points to $400
On November 4, AppLovin closed at $271.75 ahead of its earnings report. Following the release, the stock rose to around $326.23 in after-hours trading, breaking above the 50% Fibonacci retracement level of $322.45.
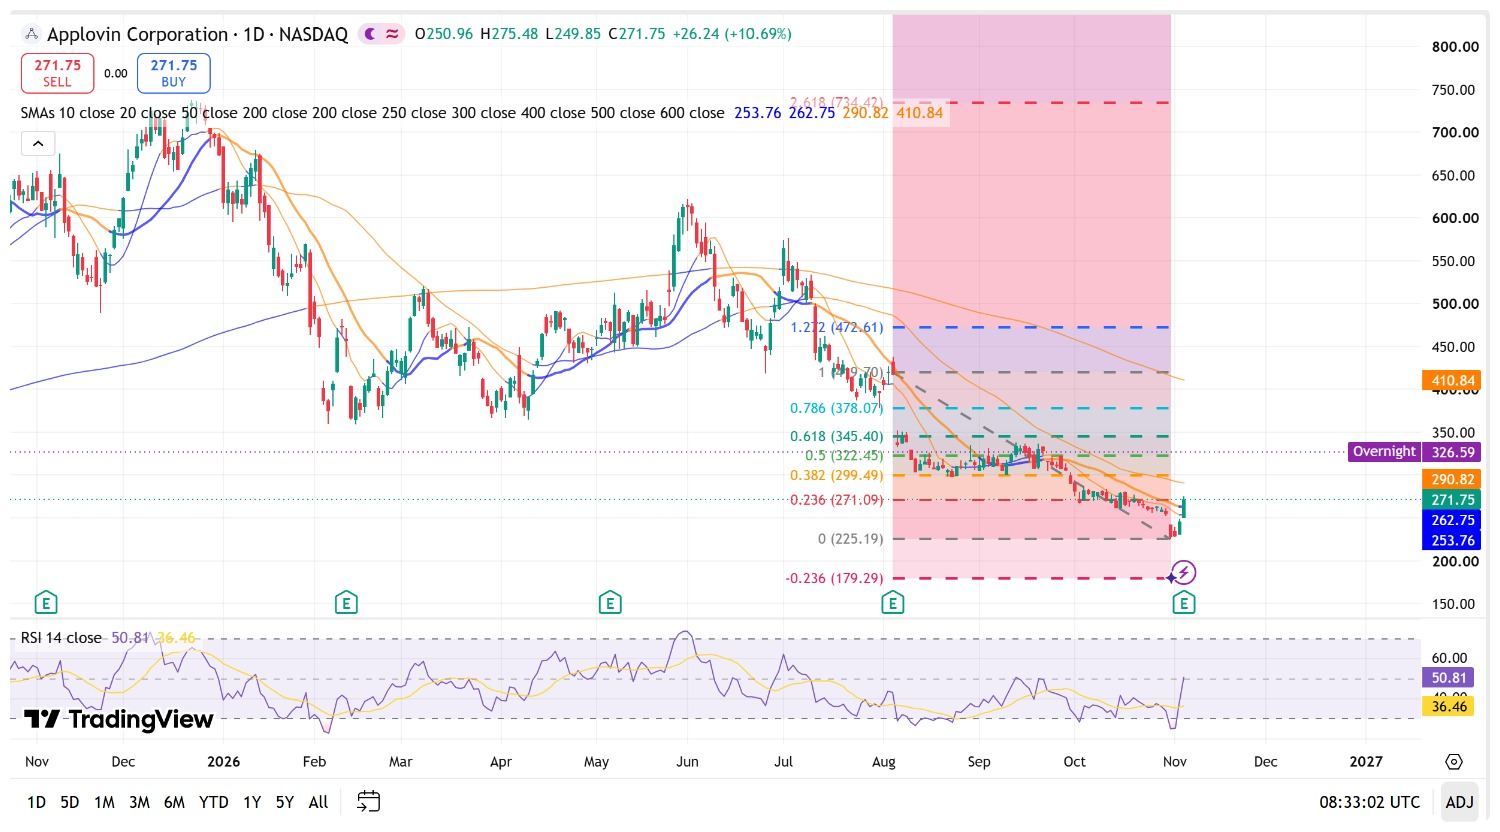
[Source: TradingView]
Calculated from the August 5 high of $419.70 to the October 30 low of $225.19, the 0.236, 0.382, 0.500, and 0.618 Fibonacci retracement levels are $271.10, $299.50, $322.45, and $345.40, respectively.
From a technical perspective, the stock has broken above the key $322 level and is poised to test $345 and $378 next. If it maintains this rebound momentum and clears these resistance levels, AppLovin shares are expected to break through $400 and retest the previous high of $419.70.
On the downside, $322 has turned into primary support; if breached, the stock could pull back to $299–$300, with further declines targeting around $271.
Ahead of the earnings release, AppLovin's 14-day RSI stood at approximately 27.7, in oversold territory. Revenue, earnings per share, and fourth-quarter guidance all exceeded market expectations, driving a sharp rebound in the stock price as improving fundamentals further reinforced technical bounce momentum.
Overall, AppLovin's near-term rebound trend is likely to continue. If the stock holds above key support and breaks through the two resistance levels of $345 and $378, $400 will become the next major breakout target.
This content was translated using AI and reviewed for clarity. It is for informational purposes only.
Recommended Articles







Comments (0)
Click the $ button, enter the symbol, and select to link a stock, ETF, or other ticker.