


Nvidia Stock Price Forecast: Shares Hit Nearly Three-Month Low Amid Seven-Day Losing Streak, Risking Drop Toward $165



AI Podcast


At the close on November 4 Eastern Time, Nvidia fell 3.17% to $200.13, marking a seventh consecutive decline and a near three-month low amid a broader AI sector pullback and rising ROI concerns. Compounding pressures include declining market share in China due to export controls and domestic competition. Technically, the stock has broken key moving averages, forming bearish death crosses. With the RSI near 34.6 and negative MACD momentum, immediate support stands at $190, below which further downside toward $165 is possible. Conversely, stabilizing above $190 could trigger a rebound toward the $207–$210 range.
TradingKey - At the close on November 4 Eastern Time, Nvidia (NVDA) shares weakened again, closing down 3.17% at $200.13 after falling to an intraday low of $199.68, marking a seventh consecutive losing session and hitting a near three-month low. Since reaching an all-time high of $243.37 on October 6, Nvidia has retreated more than 16% cumulatively, recently breaking below multiple key moving averages as its short-term downtrend persists.
Nvidia's recent ongoing pullback is linked to a broader cooling across the AI tech sector. Since October, major tech companies including Alphabet (GOOGL), Meta (META), and Amazon (AMZN) have continued to increase AI infrastructure capital expenditures, shifting market focus from the scale of AI investments to whether these outlays can generate sufficient returns.
Meanwhile, uncertainty surrounding the Chinese market has also added pressure on the stock. According to IDC data, Nvidia's share of China's data center AI chip market fell to 34% in the first half of 2026, with AI accelerator shipments down 44% year over year. U.S. export restrictions and market share gains by domestic vendors such as Huawei were cited as key factors.
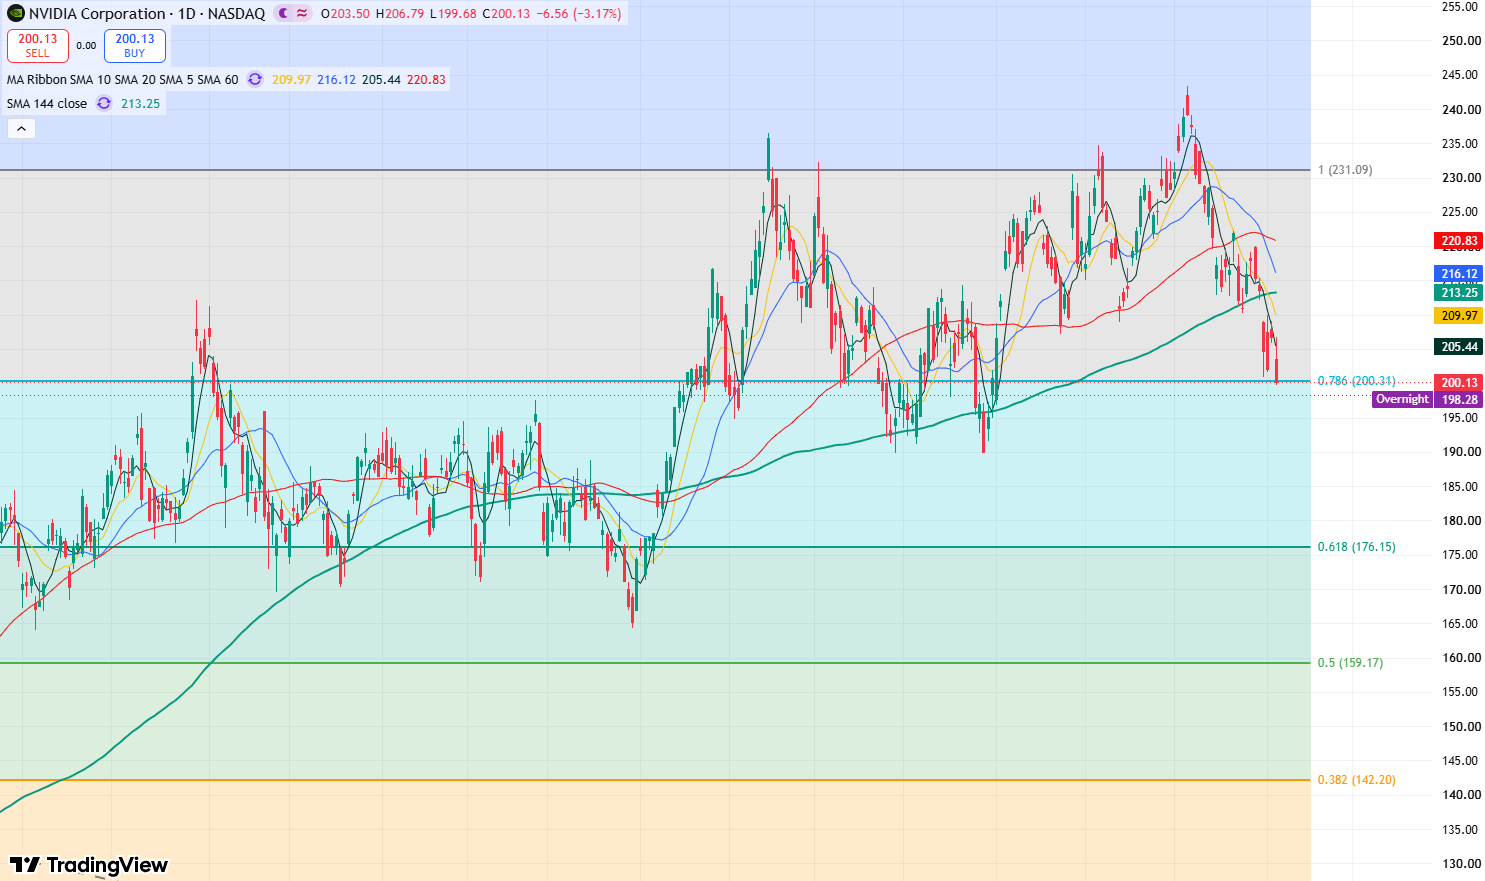
Nvidia stock daily chart, Source: TradingView
On Nvidia's daily chart, the stock recently broke below the $210 support level and fell through its 144-day moving average, significantly boosting bearish momentum. Meanwhile, the 5-day, 10-day, and 20-day moving averages crossed below the 60-day and 144-day moving averages in succession, forming death crosses across the moving average system that further reinforced bearish momentum, signaling that the stock may continue to slide in the short term.
On the technical front, the Relative Strength Index (RSI) sits near 34.6, leaving some room before entering oversold territory, while the MACD remains in negative territory, showing that downside momentum has not yet fully dissipated.
For now, the stock may continue to decline in the short term, with key immediate support at $190. If the stock falls below this level, it will open downside room toward the low of around $165 reached on March 30 this year.
Conversely, if the stock stabilizes above $190, a short-term rebound will emerge, with the primary target testing the $207–$210 range. If it can hold firmly above $210, the stock will test resistance at $220, and further upside could challenge the all-time high of $243.37.
This content was translated using AI and reviewed for clarity. It is for informational purposes only.
Recommended Articles











Comments (0)
Click the $ button, enter the symbol, and select to link a stock, ETF, or other ticker.