


Google Drops Below $330 to Near Three-Month Low Ahead of Earnings, GOOGL Could Fall Another 15%



AI Podcast


Alphabet faces downward pressure ahead of its Q3 2026 earnings release on October 28 ET, trading near a three-month low at $320.21. While consensus estimates project revenue of $127.9 billion and EPS of $3, investors remain focused on whether massive AI capital expenditures—projected at $195–$205 billion for 2026—will continue eroding profit margins and free cash flow. Google Cloud and TPU commercialization offer growth catalysts, but technical indicators signal bearish momentum. Key downside risks include breaching the $314.47 and $300 supports, potentially testing the $272.39 long-term level, with resistance clustered at the $343–$345 moving average zone.

TradingKey - Google parent Alphabet (GOOGL) will report its Q3 2026 financial results after the market close on October 28 ET, but its stock price remains under pressure ahead of the release. GOOGL last closed at $320.21, falling to a near three-month low, not only losing the $330 level but also dropping below both its 20-day and 60-day moving averages. If the earnings report fails to ease market concerns over AI capital expenditures and free cash flow, the stock price may further test the long-term support at $272, with a potential downside of nearly 15%.
The market expects the company's quarterly revenue to be approximately $127.9 billion, up about 25% year-over-year, with earnings per share expected at $3, up about 4.5% year-over-year. The gap between revenue and profit growth rates reflects investor focus on whether massive AI infrastructure spending is beginning to erode profit margins.
The core focus of this earnings report remains Google Cloud, search advertising, and capital expenditures.
In the previous quarter, Alphabet's revenue reached $119.8 billion, up 24% year-over-year; Google Cloud revenue surged 82% to approximately $24.8 billion, indicating that demand from enterprise customers for AI computing power, TPUs, and cloud platforms remains strong.
However, rapid expansion has also brought clear cash flow pressure. Alphabet raised its 2026 capital expenditure guidance to $195 billion–$205 billion, with second-quarter capital expenditure reaching $44.9 billion and recording a free cash flow deficit of approximately $5.9 billion. Therefore, even if Google Cloud maintains high growth, if management significantly raises its 2027 investment plan again, the market may still worry that depreciation, financing needs, and data center costs will continue to squeeze profits.
Meanwhile, Google's in-house TPUs have begun handling AI inference tasks in Meta (META) data centers. Improved TPU compatibility with the PyTorch ecosystem means Google's chips could further shift from internal infrastructure to the external customer market, opening up new revenue streams for its cloud business while intensifying its competition with Nvidia (NVDA) in the AI computing space.
Source: TradingView
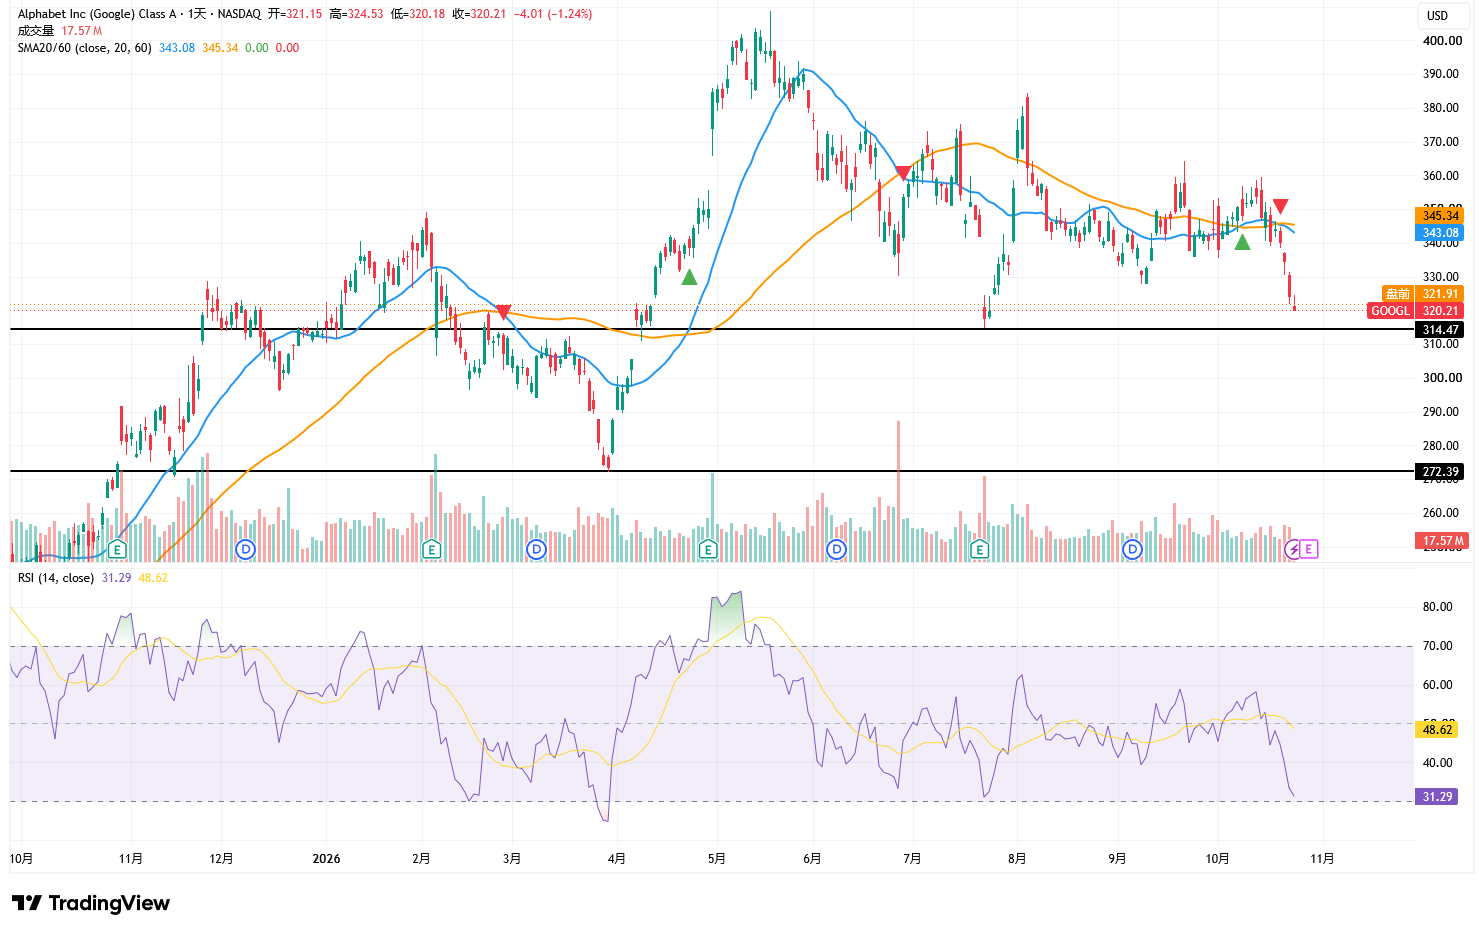
From a technical perspective, Google's stock price closed at $320.21, breaking below the $330 consolidation platform and falling back to a near three-month low. The stock is also trading below both its 20-day moving average of $343.08 and 60-day moving average of $345.34, with the 20-day moving average falling below the 60-day moving average, indicating a shift in the short-term trend from consolidation to bearish.
The first key support currently sits at $314.47, a level that has repeatedly limited stock price declines. If the stock breaks below $314 on a daily closing basis around the earnings release, the next line of defense will be the psychological $300 mark. If $300 is also broken on high volume, the stock price could further test the previous low of $272.39, representing a potential downside of about 15% from current levels.
The RSI currently stands at around 31.29, below the signal line of 48.62 and approaching oversold territory, indicating that selling pressure has not been fully released, though a technical rebound could occur in the short term. On the upside, attention is first focused on whether $330 can be reclaimed, followed by resistance concentrated in the $343–$345 dual moving average region; only firmly regaining $345 can confirm that the downtrend is starting to ease.
This content was translated using AI and reviewed for clarity. It is for informational purposes only.
Recommended Articles












Comments (0)
Click the $ button, enter the symbol, and select to link a stock, ETF, or other ticker.