


Bloom Energy Stock Forecast: Record Q3 Can't Stop BE Breaking Its Trendline as Sellers Eye $158



AI Podcast


Bloom Energy reported record third-quarter revenue of $1.24 billion and raised its full-year outlook, driven by surging fuel cell demand. Despite strong operational performance, the stock fell approximately 19% over two sessions, closing at $193.30 on Friday, October 23, weighed down by negative free cash flow of $181 million and a broader AI power sector selloff. Although forward P/E halved to 40, technical indicators remain weak. The bias stays bearish below $240.47, with key support at $158.63; a daily close below this level risks further downside toward $116.99.

TradingKey - Bloom Energy (NYSE: BE) closed the day down 11.24% at $193.30 on Friday, October 23. It came a day after the company reported record third-quarter results and raised its full-year outlook for the third time this year. However, premarket trading points slightly lower at the $192.20 level. Volume reached 34.7 million shares, about 117% above average.
The stock had already dropped about 8.7% on October 22, before the report, in a broad AI power selloff. So over the two sessions, it lost about 19% from $238.53. It now sits about 44% below its June 22 record close of $346. Still, it's up more than 122% this year.
Q3: A Clean Beat on Sales and Profit
On the earnings front, revenue rose 138% to a record $1.24 billion, up 16% from Q2. Product revenue jumped 179% to $1.07 billion. It's mainly the sale of its fuel cell power systems. Adjusted EPS came in at $0.94, well above the $0.69 analysts expected and up from $0.15 a year earlier. In simple words, adjusted EPS strips out items such as stock-based pay. Adjusted operating income reached $286 million, a 23.1% margin. Adjusted gross margin also rose about 4 points to 34.5%. That's the share of revenue left after production costs.
Overall, adjusted operating expenses rose only 26% to $141 million. That's far slower than the 138% revenue growth.
Guidance Raised for the Third Time
Bloom now expects 2026 revenue of $4.4 billion to $4.6 billion. That's about 122% growth at the midpoint. Adjusted EPS is seen at $3.10 to $3.40, with adjusted operating income of $960 million to $1.03 billion. Gross margin should stay near 34%. With $3.05 billion booked through September, the guide implies fourth-quarter revenue of roughly $1.35 billion to $1.55 billion, another record. Bloom also joined the S&P 500 during the quarter.
Cash Flow Is What Sank the Stock
Operating cash flow turned to an outflow of $27 million, as more money got tied up in inventory, contract assets and receivables. Contract assets are revenue earned but not yet billed. Capex jumped to $153 million from just $12 million a year earlier, as Bloom adds production capacity. Capex is the money spent on factories and equipment. That left free cash flow, the cash left after operating costs and capital spending, at negative $181 million.
CFO Simon Edwards stated that the cash use is "not the beginning of a trend." Year-to-date free cash flow is still positive at $42 million, and Bloom holds $2.5 billion in cash. Even so, investors in fast-growing, high-multiple stocks tend to sell first when profit doesn't turn into cash. In this case, a record quarter plus a third guidance raise didn't stop that.
The AI Power Selloff
The backdrop didn't help either. AI power stocks sold off on October 22 as worries about AI spending returned. CoreWeave and IREN hit 2026 lows that same day. Bloom's on-site fuel cells are increasingly serving data centers, so its shares move with the sentiment around the AI buildout.
Valuation Has Reset
The drop has halved Bloom's valuation. Its forward P/E fell from about 78 times on September 30 to just around 40 times at Friday's close. It's because the stock fell while earnings estimates rose. Forward P/E is simply the share price divided by next year's expected earnings. Meanwhile, JPMorgan cut its target to $292 from $314 but kept an Overweight rating, saying Bloom's execution "continues to impress." Post-report targets range from $230 at Roth to $335 at Morgan Stanley, all above Friday's close.
Bloom Energy Technical Analysis: Daily Close Below $158.63 Could Open $116.99
On the daily chart, BE gapped below the rising trendline that had supported it since late July. A gap means the stock opened well below the prior close. The trendline is simply a line drawn under the stock's higher lows, so losing it is a clear warning for buyers. BE also trades well below both moving averages at $241.71 and $248.92, so sellers are in control. Moving averages track the average price over a set period.
RSI has fallen to about 33. It's a momentum gauge that runs from 0 to 100. Momentum is weak and nearing 30, the usual oversold line, so a short bounce is possible.
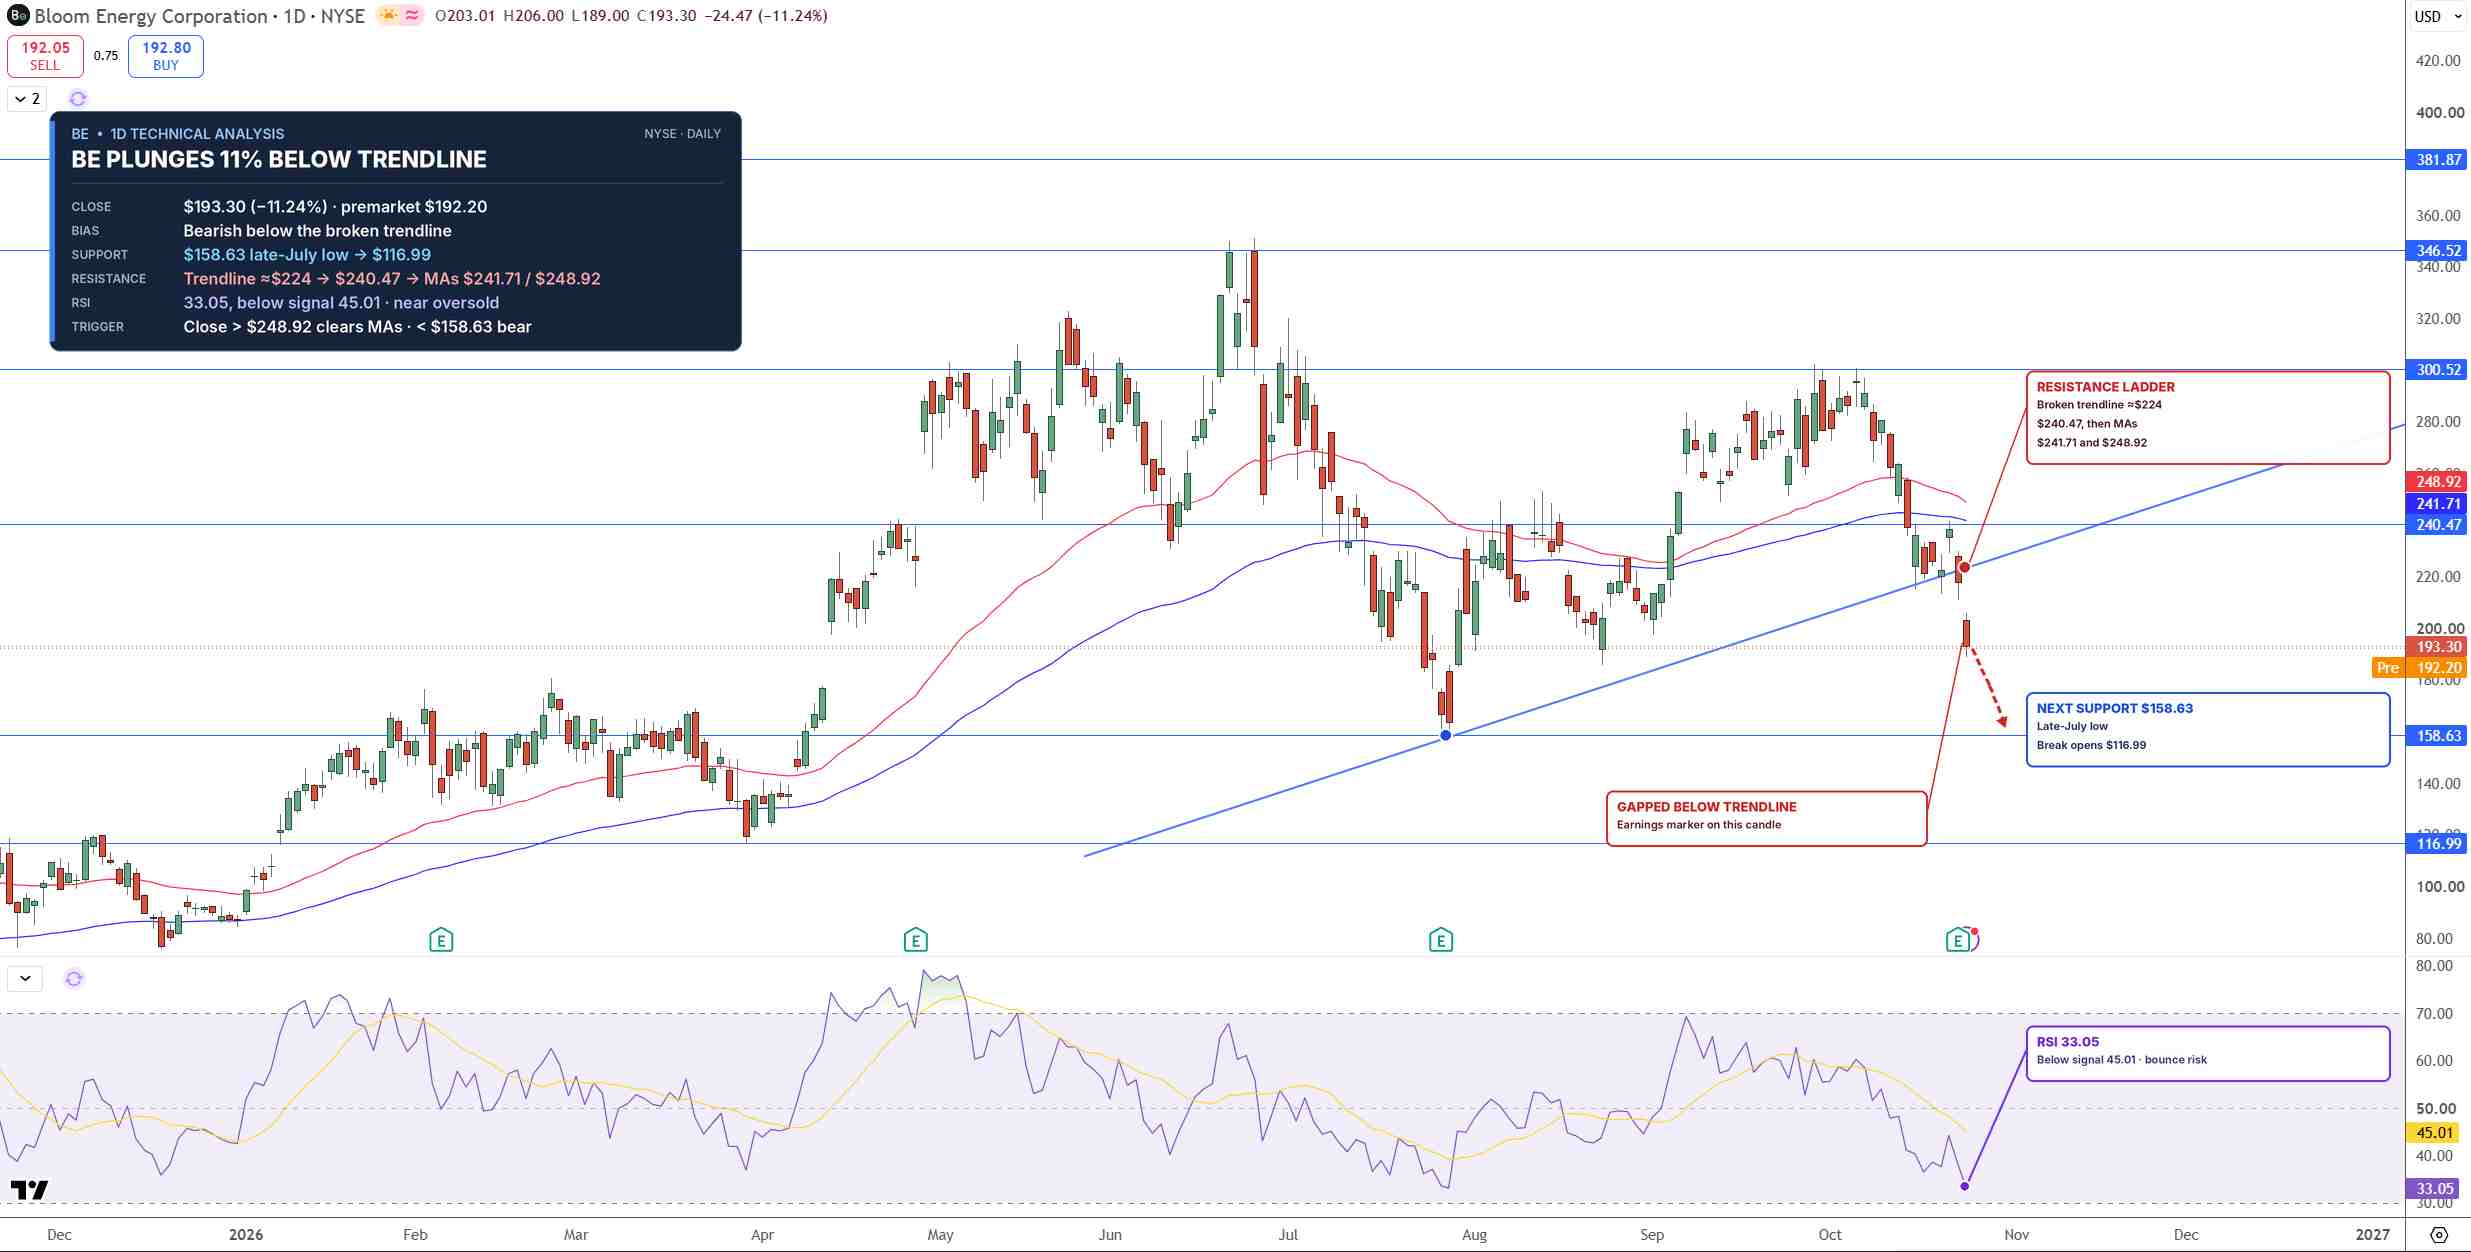
BE Price Chart - Source: Tradingview
On the downside, $158.63 is the next key support. It's a level where buyers stepped in during late July. A daily close below it would open $116.99. For buyers, a recovery would first need a daily close above $240.47. That would put price back near the moving averages.
I lean bearish as long as BE stays below $240.47.
Key Levels
- Last close: $193.30, down 11.24% on October 23
- Support: $158.63, $116.99
- Resistance: $240.47, $241.71, $248.92
- RSI: 33.05, below the 50 midline
- Bullish trigger: Daily close above $240.47
- Bearish trigger: Daily close below $158.63
FAQs
Why did Bloom Energy stock fall after earnings?
Bloom beat estimates and raised guidance. However, operating cash flow turned negative, and free cash flow fell to negative $181 million as inventory, receivables and capex rose. The drop also came during a broad AI power selloff.
What is the Bloom Energy stock forecast now?
The bias stays bearish below $240.47. A daily close below $158.63 targets $116.99. On the flip side, a close above $240.47 would be the first sign of recovery.
Bottom Line
Bloom's sales and margins are growing fast. But negative cash flow and a cooling AI trade have broken the chart's uptrend. The level that matters is $158.63, the late July floor. In my view, the stock stays under pressure below $240.47, and a daily close below $158.63 would open $116.99.
Recommended Articles












Comments (0)
Click the $ button, enter the symbol, and select to link a stock, ETF, or other ticker.