


CoreWeave Stock Price Forecast: $100 Billion in Orders Face $20 Billion Funding Gap, Financing Pressure May Drag Shares Down Another 16%



AI Podcast


CoreWeave faces severe market pressure as heavy financing requirements to fulfill its $129 billion in AI compute orders spark credit concerns. With estimated new debt needs ranging from $19.5 billion to $38 billion, elevated bond yields and credit default swap spreads reflect rising investor risk aversion. Although expanding data center capacity continues to drive revenue growth, projected capital expenditures still outpace operating cash flow, necessitating external funding. Technically, the stock remains in a bearish alignment below major moving averages, having breached its previous low, with potential downside toward the $45.06 Fibonacci support level.

TradingKey - CoreWeave (CRWV) holds over $100 billion in AI compute orders, but the massive financing required to fulfill these orders is becoming a focus of market attention.
Meanwhile, in an interview with CNBC on October 22, Jensen Huang stated that demand for neocloud companies is extremely robust, but capital shortages are constraining growth. Wells Fargo traders believe these remarks have reignited market concerns regarding AI companies' financing channels and credit investors' ability to absorb additional risk.
As investors reassess the capital requirements of AI infrastructure, CoreWeave's decline in October has exceeded 30%. However, technicals suggest that the company could still face the risk of a further 16% decline.
Why CoreWeave Is Falling: Existing Orders Still Have a Gap of About $20 Billion
According to CoreWeave's financial report, the current total, including confirmed performance obligations and new orders added in the recent third quarter, stands at approximately $129 billion.
Goldman Sachs estimates that under the assumptions of customer upfront payments accounting for 20% of relevant contract value and a GPU useful life of 4.5 to 6 years, fulfilling existing orders would require approximately $19.5 billion to $23 billion in new debt; if all 4.2 gigawatts of locked-in power capacity are further deployed, the required new debt under that scenario would be about $38 billion.
Against this backdrop, creditors remaining cautious about its financing risks was the primary trigger for the decline. For a company that needs to continuously borrow to build data centers, this pressure could push up interest expenses and slow capacity deployment, thereby impacting revenue realization and profit expectations.
As a result, CoreWeave's bond yields and credit default swap (CDS) quotes remain elevated. As of October 20, the yields on CoreWeave's two bonds maturing in 2031 and 2032 were approximately 15.97% and 15.70%, respectively, with trading prices for both falling below 80% of par value. Additionally, according to CNBC data, the company's five-year CDS spread stood at around 1,067 basis points, indicating that investors continue to demand higher compensation for credit risk.
In addition, customer upfront payments and equipment useful life are also key variables. The former brings funds in advance to reduce borrowing during construction, while the latter allows existing equipment to take on more orders, lowering new capital investment.
Currently, about 70% of contracts include upfront payment arrangements, with an average ratio of 15% to 25% of the contract value. Goldman Sachs believes that if the visibility of debt financing declines, the company may raise the upfront payment ratio to reduce its reliance on borrowing.
What Factors Could Change Stock Price Trend Expectations?
Setting aside funding pressures, deployed capacity is driving revenue growth for CoreWeave. Bank of America believes the 500 megawatts of capacity brought online in the second quarter could push operating margins above expectations; the bank expects an additional 200 megawatts to be added in the third quarter, bringing total operating capacity to 1.7 gigawatts.
Bank of America projects third-quarter revenue to more than double year-over-year to $3.66 billion, with operating margin reaching 6.7%. Meanwhile, Goldman Sachs maintains its "Buy" rating and a $106 price target, implying an upside of approximately 71.5% from the October 21 closing price of $61.82.
Goldman Sachs forecasts that the company's revenue will grow from $12.96 billion in 2026 to $47.54 billion in 2028, with net income including special items turning positive in 2028 to around $1.38 billion. However, operating cash flow for that year is projected at $34.16 billion, remaining below capital expenditures of $49.94 billion, indicating that expansion will still require external funding.
This also explains the current market divergence: newly added capacity is driving performance improvements, while ongoing financing determines whether growth can be delivered as planned.
CoreWeave Technical Analysis
From a technical standpoint, CoreWeave has broken below its late-July low of $60.55 and is trading below all major moving averages. The current movement represents a continuation of the decline following the breach of the prior low, with no structure yet emerging to confirm a bottom.
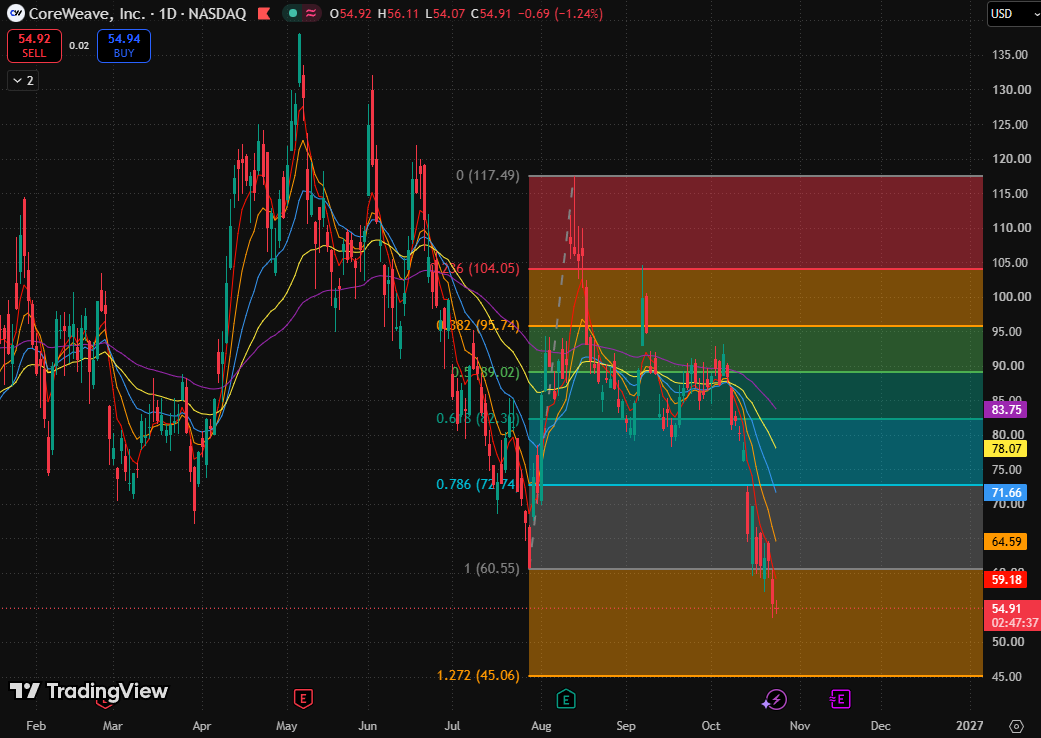
CoreWeave daily chart, Source: TradingView
Regarding moving averages, the 5-day EMA ($59.18), 10-day EMA ($64.59), 20-day EMA ($71.66), 80-day EMA ($78.07), and 160-day EMA ($83.75) are arranged in ascending order and sloping downward, forming a complete bearish alignment. The rapid downward pressure from short-term EMAs suggests that even if a rebound occurs, it will first encounter overhead resistance that trends downward over time.
The stock is currently fluctuating narrowly between $54.07 and $56.11—narrowing volatility following a sharp drop merely indicates a pause in the decline, which alone cannot confirm a bottom.
In terms of upside potential, a repair of the breakdown is contingent on the daily chart regaining $60.55 and holding it during a pullback. If the stock breaks down further, it will seek support at the 1.272 Fibonacci extension level ($45.06).
This content was translated using AI and reviewed for clarity. It is for informational purposes only.
Recommended Articles










Comments (0)
Click the $ button, enter the symbol, and select to link a stock, ETF, or other ticker.