


Intel Stock Forecast: INTC Falls 8% Toward $81.64 Support Ahead of the October 29 Margin Test



AI Podcast


Intel shares declined 8.04% to $85.49 on Thursday, October 22, amid a broader semiconductor selloff and macroeconomic pressures, despite no operational updates. Ahead of its third-quarter report on Thursday, October 29, market focus centers on gross margin guidance and the 18A manufacturing ramp. Analysts anticipate revenue of $16.45 billion to $16.50 billion and adjusted EPS of $0.39 to $0.40. Technically, the stock remains under bearish pressure, with key support at $81.64. A daily close below this threshold could trigger a slide toward $70.23, while a recovery above $95.50 would signal potential stabilization.
Intel (NASDAQ: INTC) heads into this week’s third-quarter report after an 8.04% drop to $85.49 on Thursday, October 22, when a broad chip selloff hit the stock days after a price target cut. Shares sit about 40% below their 52-week high of $142.35 and had already dropped about 15% in the month to October 19.
The slide came without any change to Intel's own outlook. That puts the focus on Thursday, October 29, when Intel reports third-quarter results after the close, with the call at 5:00 p.m. ET.
What Drove Thursday's Drop
The Philadelphia Semiconductor Index, a widely followed chip-stock benchmark, fell 6.72% to its lowest close since July 29 after Lam Research flagged supply limits and Meta's spending revived worries about AI funding. Brent crude also topped $112 a barrel after attacks in Saudi Arabia, adding to fears of sticky inflation, even as Treasury yields fell sharply. Earlier in the week, Susquehanna had cut its Intel target to $105 from $115 and kept a Neutral rating.
What the Street Expects
Analysts expect revenue of about $16.45 billion to $16.50 billion, above the midpoint of Intel's $15.8 billion to $16.8 billion guide, against $13.65 billion a year earlier. Adjusted EPS, which strips out items such as stock-based pay and restructuring costs, is expected at about $0.39 to $0.40, versus Intel's $0.38 guide and $0.23 a year ago. Intel has beaten EPS estimates in five of its last eight quarters.
Q2 Set a High Bar
In July, revenue rose 25% to $16.13 billion, far above the $14.42 billion expected, and adjusted EPS of $0.42 doubled the $0.21 consensus. Data Center and AI revenue jumped 59% to $6.3 billion. Management said demand continues to outpace supply, with new supply weighted toward late Q3 and Q4, especially for servers, while PC demand stays soft because of memory shortages.
Gross Margin Is the Number to Watch
Adjusted gross margin, the share of revenue left after production costs, reached 41.8% in Q2, about 2.8 points above guidance. The Q3 guide of 42.0% adds only 0.2 points, so the climb is slowing. A Q4 margin guide at or above 42% would show that pricing and the ramp of 18A, Intel's newest manufacturing process, are still lifting profits. A lower guide would give the selloff a reason it does not have yet.
Foundry Progress and Terafab Questions
Intel said 18A output ran about 25% above target, 14A is on track for risk production in the second half of 2027, and external foundry revenue reached $293 million in Q2. The customer story is less clear. Intel joined Elon Musk's Terafab chip project in April, but on October 3 Musk disclosed talks with TSMC about the same project. CEO Lip-Bu Tan said Intel would keep working on it.
The October 14 blast at Intel's Kiryat Gat plant in Israel, which killed two workers, is also worth watching on the call, since Intel has not commented on any production impact.
Capex, Valuation and Analysts
In July, Intel raised its 2026 and 2027 plans for capex, the money it spends on factories and equipment, and more spending leaves less free cash flow, the cash left after operating costs and capital spending. Even after the drop, GuruFocus puts the stock at about 40 times forward earnings. The consensus rating is Hold, with average targets of about $108 to $114. KeyBanc is the most bullish, with a Buy rating and a $155 target.
Intel Technical Analysis: Daily Close Below $81.64 Could Open $70.23
That sector pressure shows up clearly on the daily chart, where INTC has dropped fast since failing at $126.78 in late September. It now trades well below both moving averages, which track the average price over a set period, at $99.98 and $103.12, a clear sign that sellers are in control.
RSI, a momentum gauge that runs from 0 to 100, has slid to about 30, right at the oversold line. Oversold means the selling may have gone too far too fast, so a bounce is possible, though not guaranteed.
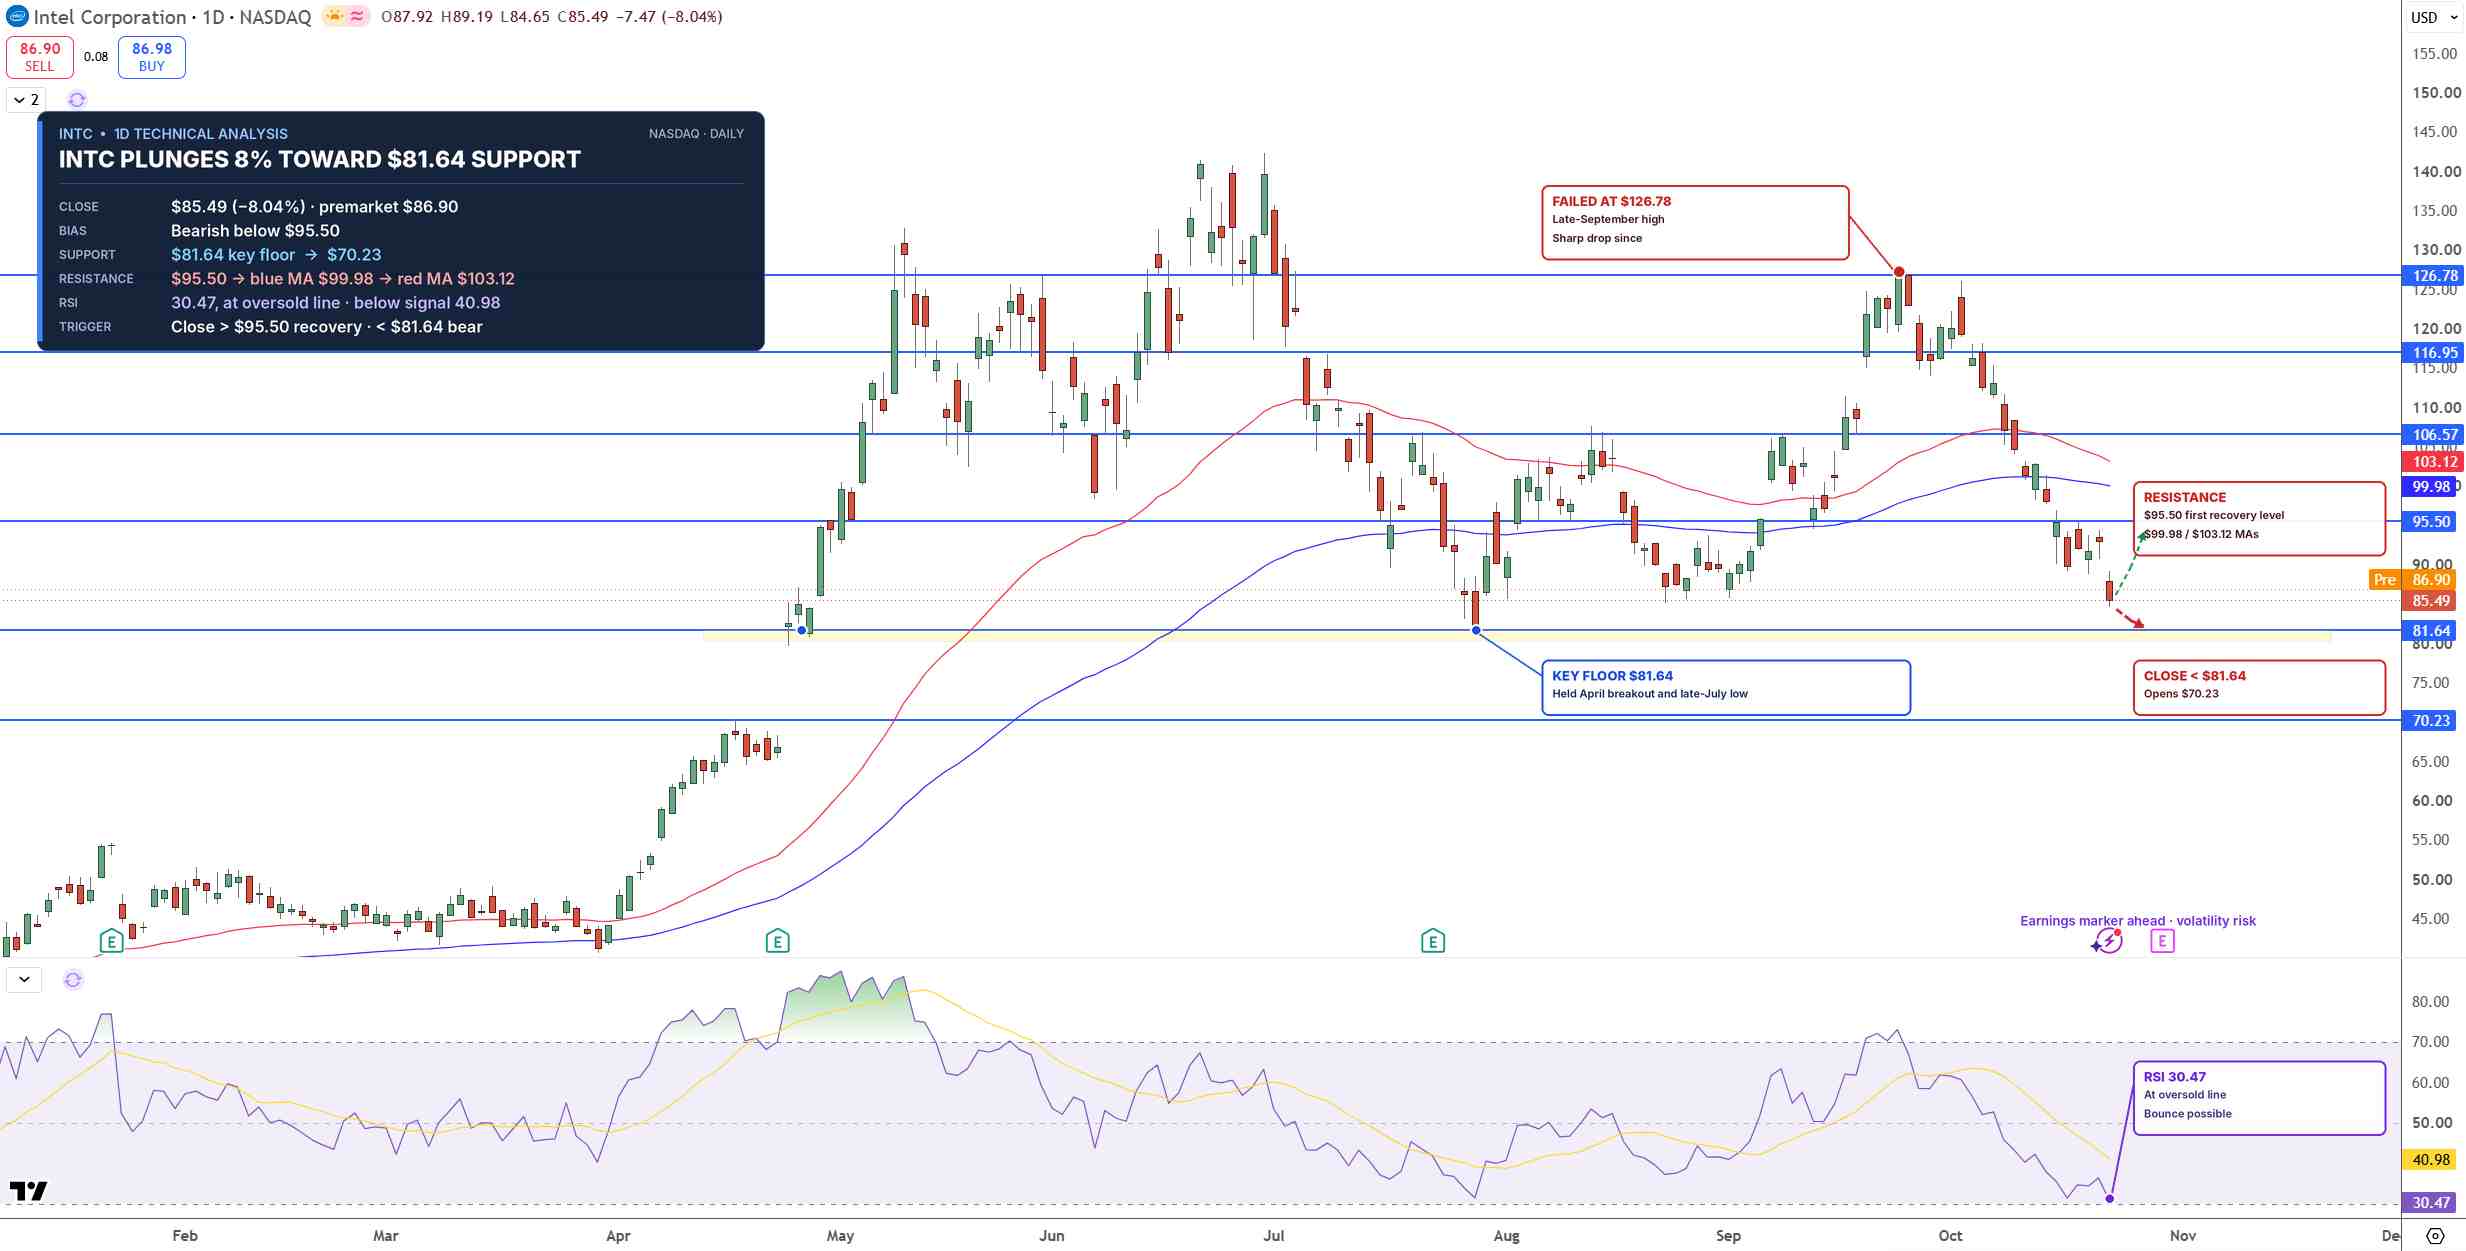
INTC Price Chart - Source: Tradingview
The key floor is $81.64, the support level that stopped the July selloff. Support is a price where buyers have stepped in before. A daily close below it would open the way for $70.23. For buyers, a daily close above $95.50 would be the first sign of recovery and would open $99.98. Price still sits well short of that level.
I lean bearish while INTC stays below $95.50.
Key Levels
- Last close: $85.49, down 8.04% on October 22
- Support: $81.64, $70.23
- Resistance: $95.50, $99.98, $103.12, $126.78
- RSI: 30.47, at the oversold line
- Bullish trigger: Daily close above $95.50
- Bearish trigger: Daily close below $81.64
FAQs
Why did Intel stock fall 8% on October 22?
Intel fell 8.04% as chip stocks sold off on AI spending worries and Brent crude topped $112, days after Susquehanna cut its target to $105. Intel itself did not change its outlook.
What is the Intel stock forecast before earnings?
The bias is bearish below $95.50. A daily close below $81.64 targets $70.23, while a close above $95.50 would open $99.98.
Bottom Line
Intel's drop came from the sector and the macro backdrop, not from its own numbers, so the October 29 margin guide will decide whether the selling went too far. The level that matters is $81.64, the July low. In my view, a daily close below it opens $70.23, while a close above $95.50 would be the first real sign of repair.
Recommended Articles








Comments (0)
Click the $ button, enter the symbol, and select to link a stock, ETF, or other ticker.