


Robinhood Stock Forecast: HOOD Tests $95.11 Trendline Support Ahead of Tuesday's Q3 Report



AI Podcast


Robinhood Markets heads into its Q3 earnings report on Tuesday, October 27, 2026, amid pre-earnings caution and a broader growth-stock selloff. Analysts project revenue of $1.42 billion to $1.43 billion and EPS of $0.55 to $0.56. While declining crypto revenue is offset by surging event contracts and robust subscriber growth, technical indicators show short-term momentum favoring sellers. The stock is currently testing a critical rising trendline support at $95.11. A daily close below this level risks a slide toward $85.30, whereas a strong earnings beat and a close above $103.32 would re-establish the bullish uptrend.

TradingKey - Robinhood Markets (NASDAQ: HOOD) heads into its earnings week sitting on a key support level. The stock fell 5.25% to $96.58 on Thursday, October 22, as the AI and chip selloff hit high-growth names. Shares are about 36% below their 52-week high of $150.47.
The drop came on the same day Robinhood won a Dubai license, which shows how little company news mattered in that selloff. Robinhood reports third-quarter results after the close this Tuesday, October 27, with a video call at 5:00 p.m. ET.
What the Street Expects
Analysts expect revenue of about $1.42 billion to $1.43 billion, up roughly 12% from $1.27 billion a year earlier. EPS is expected at about $0.55 to $0.56, below the $0.61 reported a year ago. Robinhood has beaten EPS estimates in five of its last eight quarters, according to MarketBeat.
Expecting lower EPS on double-digit revenue growth sets up a clear test. A beat would challenge the idea that growth is slowing, while a miss would support it.
Q2: Record Revenue, With Help From a One-Off Gain
In July, revenue rose 32% to a record $1.31 billion, and EPS of $0.62 topped the $0.44 consensus. Part of that profit came from about $129 million of gains, mainly from deconsolidating a venture fund, meaning Robinhood stopped counting that fund in its own accounts. Net deposits, the new money customers added minus withdrawals, hit a record $21.7 billion. Robinhood Gold, its paid subscription, reached 4.8 million subscribers, up 39%, and funded customers rose 7% to 28.4 million.
Event Contracts Are Replacing Crypto Growth
Inside transaction revenue, event contracts, which let users trade on outcomes such as sports results or economic data, brought in $156 million in Q2, more than 10 times a year earlier. Crypto revenue fell 38% to $100 million, its third straight quarterly decline. Options revenue rose 29% to $342 million and equities revenue jumped 95% to $129 million.
September data point the same way. From September 1 to 24, Robinhood customers traded about 4.4 billion event contracts. Crypto notional volume, the total value of trades, was about $17 billion, but only $7 billion of that came through the Robinhood app, with $10 billion on Bitstamp, its mostly institutional exchange. Equity notional volume reached about $267 billion and options contracts about 234 million.
Dubai License and Cost Control
On October 22, the Dubai Financial Services Authority authorized Robinhood to launch its retail investing platform in the Middle East next year from the Dubai International Financial Centre. In July, Robinhood also lowered its 2026 adjusted operating expense and stock-based pay guidance to $2.675 billion to $2.775 billion, from $2.70 billion to $2.825 billion, which helps protect margins if trading slows.
Valuation and Analysts
HOOD trades at about 43 times trailing earnings and 38 times forward earnings, a premium to traditional brokers. The average analyst target sits around $130 to $134. Bank of America raised its target to $156 from $140 with a Buy rating on October 5, while Wells Fargo cut its target to $120 from $125 with an Equal Weight rating on October 14.
Robinhood Technical Analysis: Daily Close Below $95.11 Could Open $85.30
The pre-earnings caution shows up on the daily chart, where HOOD is sitting right on its rising trendline from the April low, a line drawn under the higher lows of the uptrend, which lines up with $95.11 support. Support is a price where buyers have stepped in before, and Thursday's low near $95.62 held just above it. Price has already slipped below both moving averages, which track the average price over a set period, at $103.32 and $106.75, so short-term momentum favors sellers.
RSI, a momentum gauge that runs from 0 to 100, is near 38. Momentum is weak but not yet oversold, which starts below 30.
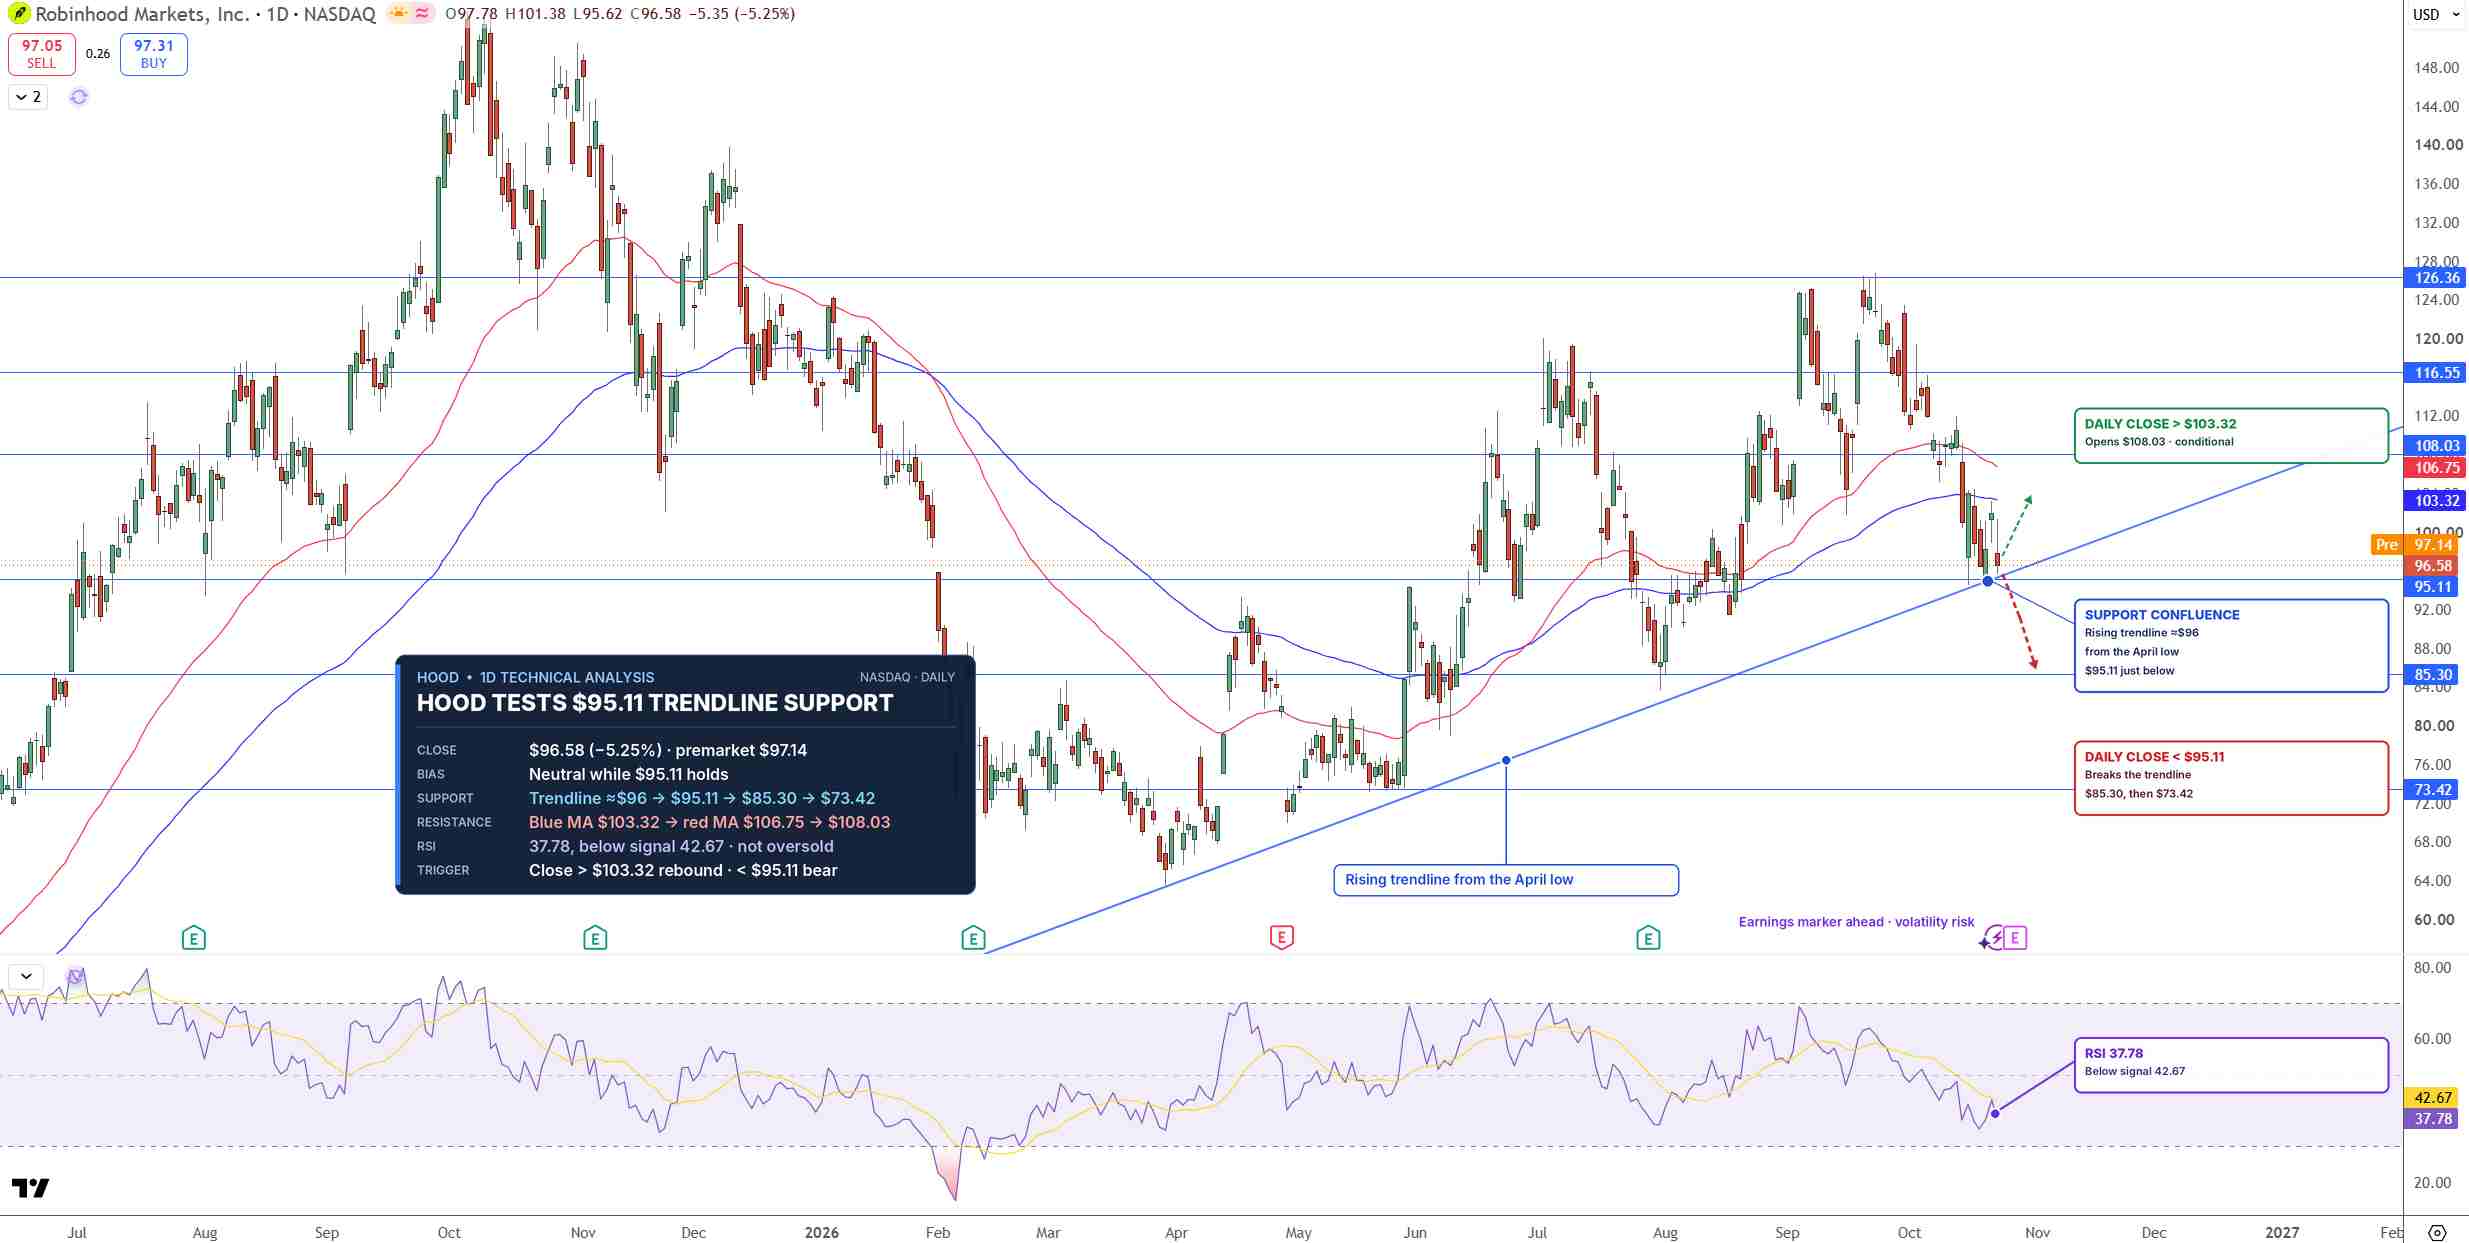
HOOD Price Chart - Source: Tradingview
If buyers hold this floor, a daily close above $103.32 would open the way for $108.03. A daily close below $95.11 would break the trendline and open $85.30, then $73.42.
I would stay neutral while HOOD holds $95.11, since Tuesday's report is likely to decide which way it breaks.
Key Levels
- Last close: $96.58, down 5.25% on October 22
- Support: $95.11, $85.30, $73.42
- Resistance: $103.32, $106.75, $108.03
- RSI: 37.78, below the 50 midline
- Bullish trigger: Daily close above $103.32
- Bearish trigger: Daily close below $95.11
FAQs
When does Robinhood report Q3 2026 earnings?
Robinhood reports after the close on Tuesday, October 27, 2026, with a video call at 5:00 p.m. ET. Analysts expect revenue of about $1.42 billion to $1.43 billion and EPS of about $0.55 to $0.56.
What is the Robinhood stock forecast before earnings?
The bias is neutral while HOOD holds $95.11. A daily close below it targets $85.30 and $73.42, while a close above $103.32 would open $108.03.
Bottom Line
Robinhood's prediction markets are growing fast enough to cover the slide in crypto revenue, but analysts still expect EPS to fall from a year ago. The level that matters is $95.11, where the April trendline sits. In my view, a daily close below it opens $85.30, while a strong report and a close above $103.32 would put the uptrend back in control.
Recommended Articles










Comments (0)
Click the $ button, enter the symbol, and select to link a stock, ETF, or other ticker.