


American Express Stock Forecast: Q3 Beat and Higher Guidance Leave AXP Just Below $327 Resistance



AI Podcast


American Express reported third-quarter revenue of $20.06 billion and adjusted EPS of $4.68, beating estimates and raising its full-year earnings floor. However, the profit beat relied primarily on a lower tax rate, credit reserve releases, and share buybacks rather than operational acceleration, with billed business growth slowing to 8%. Technically, the stock maintains a cautiously bullish bias above the $313.02 support level. A daily close above immediate resistance at $327.24 could trigger further upside toward $343.10.

TradingKey - American Express (NYSE: AXP) reported third-quarter results before the open on Friday, October 23, beating on adjusted EPS and raising its full-year earnings outlook. The stock closed at $325.17 on Thursday, up 0.48%, and premarket trading sits slightly lower near $323.00. Even after a gain of about 4% this week, shares are down about 12% this year.
Underneath the beat, a lower tax rate, a release of credit reserves and buybacks did most of the work, while card spending growth slowed. That is likely why a beat-and-raise has not lifted the stock before the open.
Q3 Headline Numbers
Revenue rose 9% to a record $20.06 billion, roughly in line with the $20.12 billion consensus. Adjusted EPS, which strips out one-off items, rose 13% to $4.68, above estimates of about $4.49 to $4.58. GAAP EPS jumped 31% to $5.42 and net income rose 28% to $3.71 billion. Billed business, the total amount spent on Amex cards, rose 8% to $454.0 billion.
The gap between GAAP and adjusted results comes from two items. Amex booked a $982 million pre-tax gain from selling its stake in Global Business Travel Group and took a $336 million restructuring charge tied to efficiency plans.
Guidance Raised, but the Ceiling Stayed
Amex raised its full-year GAAP EPS guidance to $18.30 to $18.60, from $17.30 to $17.90. On an adjusted basis, which excludes the travel stake gain and the restructuring charge, the new range is $17.60 to $17.90. That lifts the floor but leaves the top of the old range unchanged. Amex still expects revenue growth of about 10%.
Tax, Reserves and Buybacks Did the Heavy Lifting
Strip out the stake gain and the restructuring charge, and pre-tax income rose only about 1% from a year earlier. The 13% adjusted EPS growth leaned on three things. The effective tax rate fell to 18.1% from 24.1% because of discrete benefits from settling prior-period tax items. Credit provisions, the money set aside for expected loan losses, dropped to $1.0 billion from $1.3 billion as Amex released reserves this quarter after building them a year ago. Average diluted shares also fell 3% to 674 million thanks to buybacks.
None of these are signs of weakness, but they are harder to repeat than growth driven by spending.
Spending Cooled Slightly
Billed business growth slowed to 8% from 9% in Q2, and the total dipped from $455.8 billion last quarter. Revenue growth also eased to 9% from 10%. Credit quality, on the other hand, stayed strong, with the net write-off rate, the share of loans written off as unpaid, falling to 1.8% from 1.9%.
Costs, Legal Reserves and Partnerships
Total expenses rose 9% to $14.5 billion, mainly from higher customer engagement costs tied to more spending and the US Platinum Card refresh. Amex also raised legal reserves for previously disclosed matters. That follows the $350 million anti-money laundering penalty announced on October 8, which CEO Stephen Squeri said does not affect 2026 guidance.
On the business side, Amex extended its partnership with Marriott, including the US co-brand cards, launched an exclusive Airbnb partnership that adds more than 1 million listings to Amex Travel, and ranked first in J.D. Power's US credit card satisfaction study for the seventh straight year.
American Express Technical Analysis: Daily Close Above $327.24 Could Open $343.10
On the daily chart, the trend still favors buyers. They defended the $298.63 support zone strongly in early October, near a long-term rising trendline, a line drawn under the stock's higher lows. Support is a price where buying has stopped declines before. Since then, AXP has climbed back above both moving averages, which track the average price over a set period, at $317.76 and $322.35, a healthy sign for buyers.
RSI, a momentum gauge that runs from 0 to 100, has risen to about 66. Momentum is strong, but readings above 70 count as overbought, so the stock could pause soon.
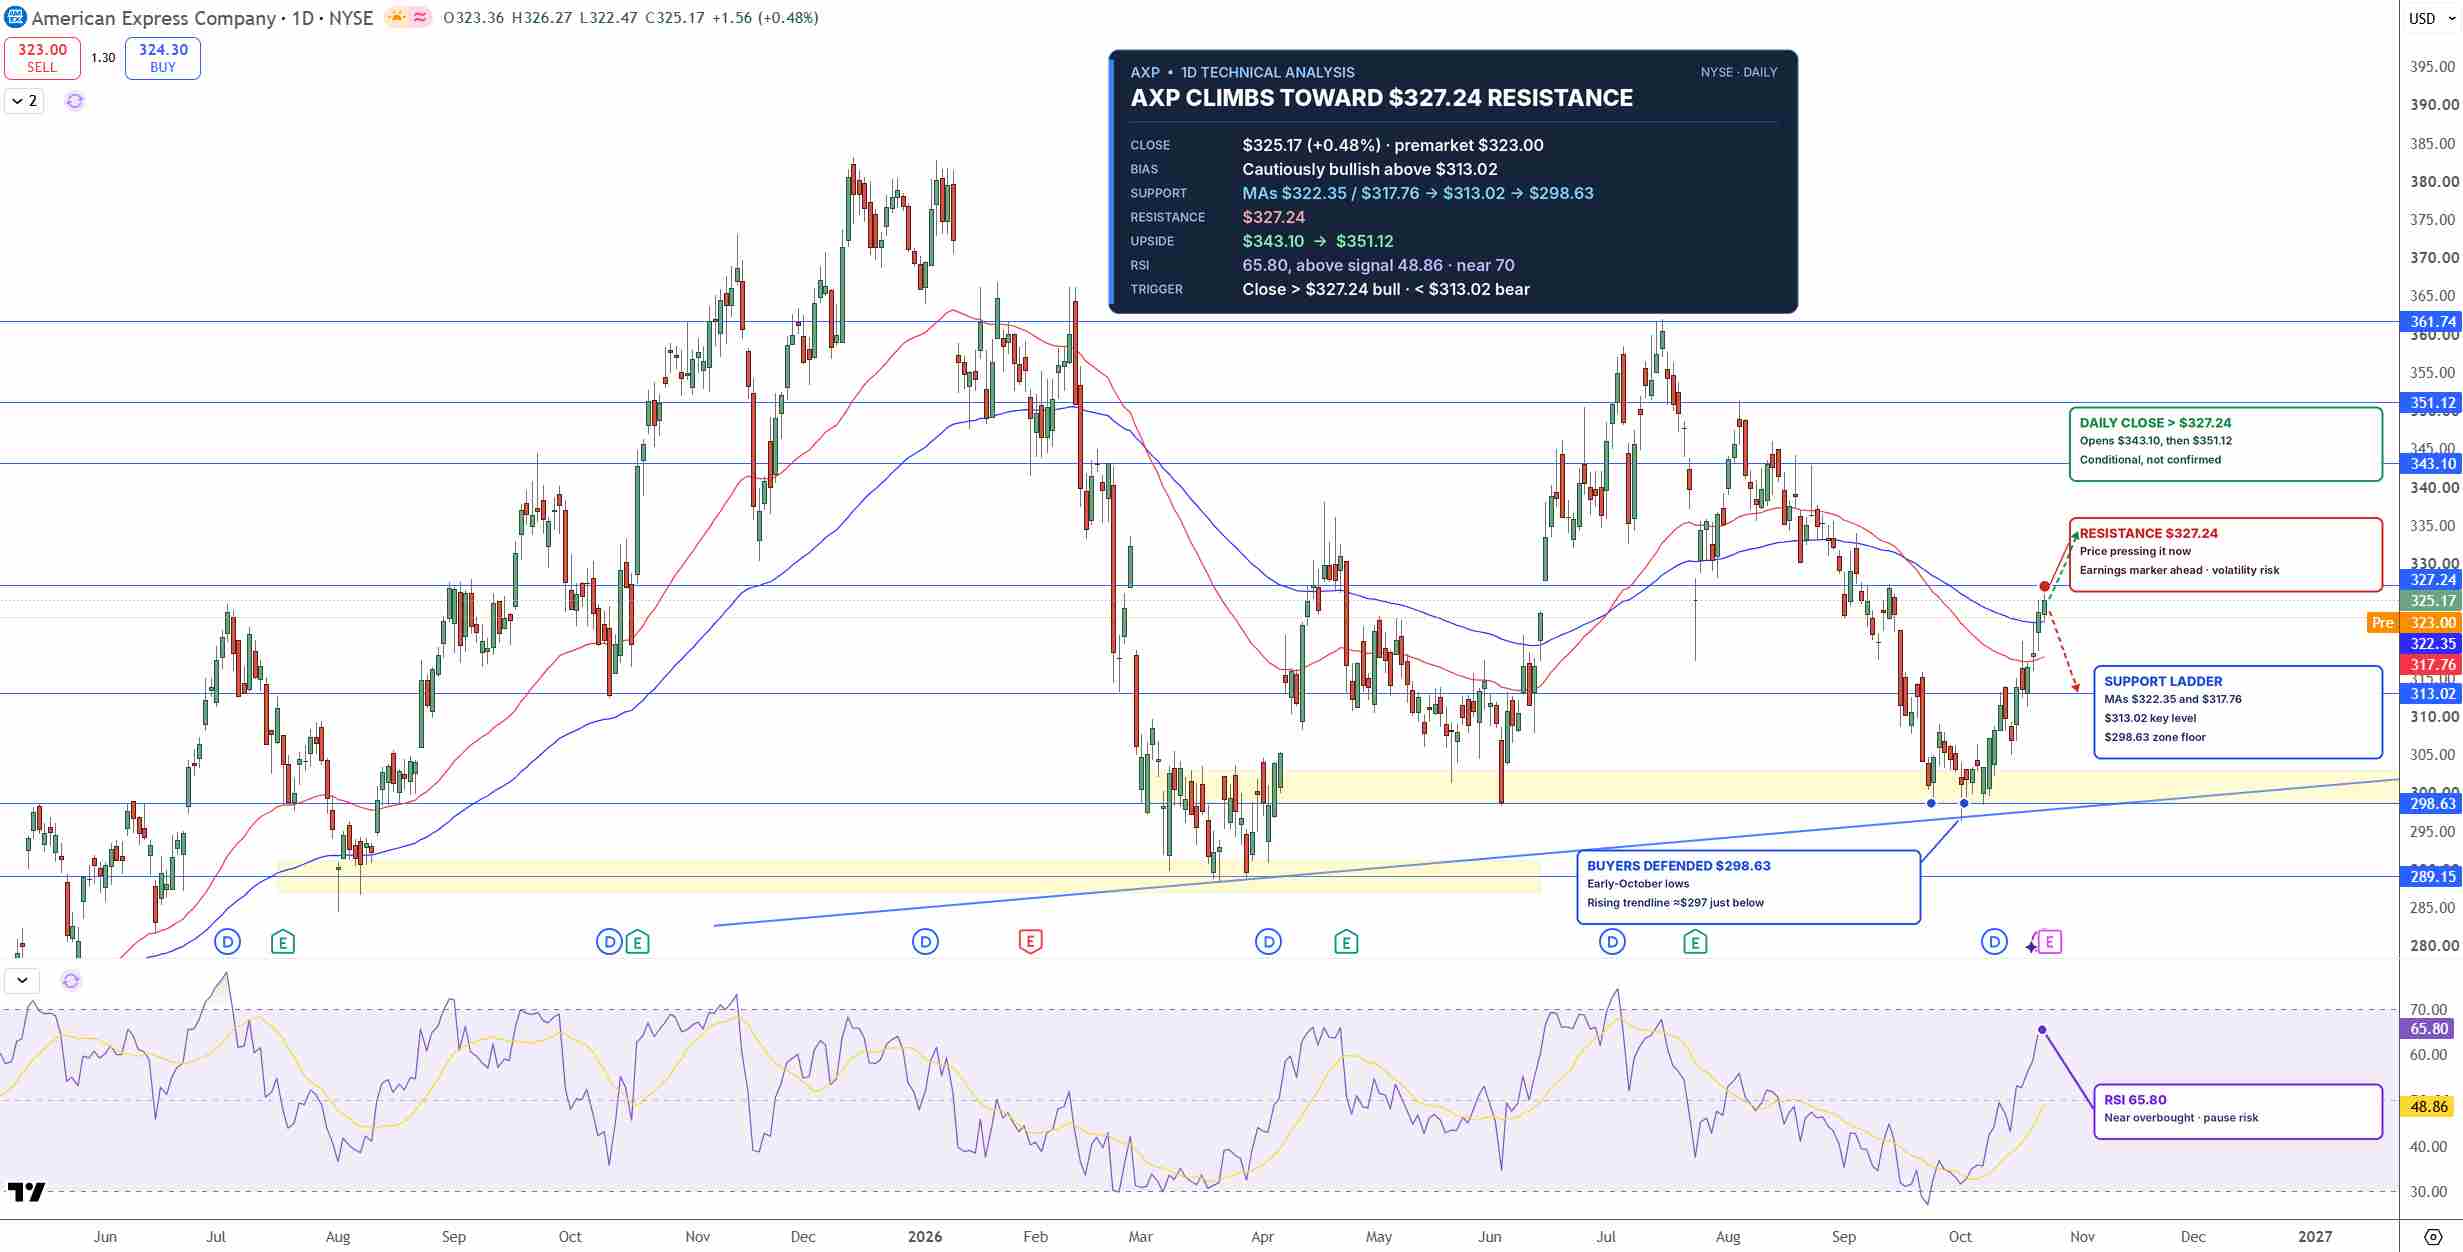
AXP Price Chart - Source: Tradingview
AXP now faces resistance, a level where selling has capped rallies, at $327.24, only about $2 above Thursday's close, so the first session after earnings is likely to test it. A daily close above it would open the way for $343.10, then $351.12. If sellers return, $313.02 is the first support, followed by $298.63.
I lean cautiously bullish while AXP holds above $313.02.
Key Levels
- Last close: $325.17, up 0.48% on October 22
- Support: $322.35, $317.76, $313.02, $298.63
- Resistance: $327.24, $343.10, $351.12
- RSI: 65.80, above the 50 midline
- Bullish trigger: Daily close above $327.24
- Bearish trigger: Daily close below $313.02
FAQs
Did American Express beat Q3 2026 earnings expectations?
Yes. Adjusted EPS of $4.68 beat estimates of about $4.49 to $4.58, and revenue of $20.06 billion was roughly in line. Amex also raised full-year GAAP EPS guidance to $18.30 to $18.60.
What is the American Express stock forecast after earnings?
The bias is cautiously bullish above $313.02. A daily close above $327.24 targets $343.10 and $351.12, while a close below $313.02 would put $298.63 back in play.
Bottom Line
Amex delivered a beat and a higher guidance floor, but most of the EPS growth came from tax, reserves and buybacks while spending growth cooled. The level that matters is $327.24. In my view, a daily close above it opens $343.10, while a drop below $313.02 would put the October low at $298.63 back in focus.
Recommended Articles











Comments (0)
Click the $ button, enter the symbol, and select to link a stock, ETF, or other ticker.