


SpaceX Stock Price Forecast: Which Expectations Were Validated by Successful Falcon 9 Launch?



AI Podcast


On October 20 Eastern Time, SpaceX successfully completed the Falcon 9 Bandwagon-5 mission, deploying 31 payloads and recovering the first-stage booster, validating fourth-quarter revenue recognition and reusability models. Institutional analyses highlight launch frequency and cost reduction as key valuation drivers. Technically, SpaceX shares are experiencing weak consolidation below major moving averages and the 0.618 Fibonacci retracement level of $147.97. A sustained move above $147.97 could trigger a recovery toward $153.40, while a close below the 160-day EMA at $146.64 risks further downside toward $140.24.

TradingKey - On October 20 Eastern Time, SpaceX (SPCX)'s Falcon 9 rocket completed the Bandwagon-5 mission, carrying 31 customer payloads and the company's own Starfall capsule. As of 8:45 a.m. that day, all customer payloads had been deployed, and the first-stage rocket executing the mission was also successfully recovered after its 19th flight.
Falcon 9 Successfully Launches: Which Expectations Were Validated?
The most direct change from this mission is that 31 customer payloads moved from awaiting launch into the actual delivery phase. SpaceX disclosed that launch service revenue is typically recognized upon launch or when customer payloads are deployed to target orbits. Therefore, completing the mission helps account for the related contract revenue in the fourth quarter.
The recovery of the first-stage rocket once again supports the existing thesis that Falcon 9 can be continuously reused. Meanwhile, peer Starfall completed its second launch, adding another verification opportunity for SpaceX as it explores payload return services.
Notably, Morningstar listed launch frequency, payload mass delivered, and average launch cost as profitability drivers for the launch business in its SpaceX valuation research, while PitchBook also incorporated Falcon 9 launch counts into its financial model. Goldman Sachs' space industry analysis, on the other hand, emphasized that evaluating future revenue also requires examining the quality of customers and order schedules.
More compelling evidence for stock price expectations would be if subsequent customer launch volumes and revenue consistently exceed original institutional forecasts, alongside a genuine reduction in reuse costs.
SpaceX Technical Analysis
SpaceX shares have continued to pull back after surging, currently sitting below the 0.618 Fibonacci retracement level ($147.97) and returning to near the 160-day exponential moving average.
The current price action represents weak consolidation following a pullback near the long-term moving average. Although rebounding from an intraday low of $143.27, it has yet to reclaim the key retracement level.
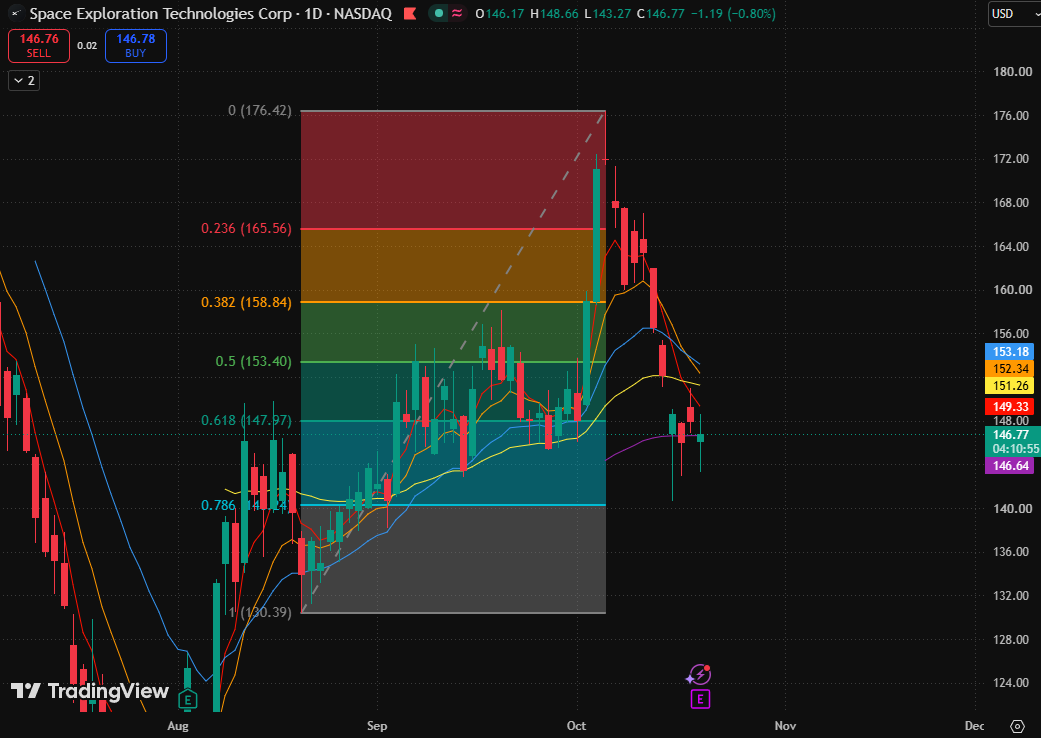
SpaceX daily chart. Source: TradingView
In terms of moving average structure, the current price sits below all five moving averages, with short- to medium-term rebounds remaining suppressed by them. The 160-day exponential moving average stands at $146.64, serving as the nearest long-term support for now. However, the five moving averages do not form a standard, fully bearish alignment; a more accurate description of the current situation is short- to medium-term weakness with the long-term moving average being tested.
On the upside, if the daily chart reclaims and holds above $147.97, the stock price is expected to initiate a new round of recovery. The next target range is the $149.33 to $153.40 region, which encompasses the 5-day EMA, 80-day EMA, 10-day and 20-day EMAs, as well as the 0.5 Fibonacci retracement level.
If the closing price falls below $146.64, downside pressure could further push the price toward the vicinity of $143.27 and $140.24.
This content was translated using AI and reviewed for clarity. It is for informational purposes only.
Recommended Articles











Comments (0)
Click the $ button, enter the symbol, and select to link a stock, ETF, or other ticker.