


TSMC Shares Fall Toward $400 as Strong Q3 Results Fail to Offset CPI Headwinds



AI Podcast


On October 15, TSMC reported Q3 2026 financial results, with consolidated revenue reaching NT$1.494 trillion and EPS surging 68.7% year-over-year to NT$29.43, both exceeding market expectations. Despite this record profitability, hotter-than-expected US September CPI data fueled macroeconomic headwinds, tightening liquidity, and delayed rate-cut expectations. Consequently, semiconductor stocks faced widespread sell-offs, causing TSMC's stock price to drop over 2% in pre-market trading. Broader market liquidation risks pushing the stock toward the $400 psychological mark and 120-day moving average, a level expected to trigger strong institutional value buying.

TradingKey - TSMC achieves major revenue and profit gains in Q3, but struggles against strong macroeconomic headwinds; stock price risks testing the $400 mark.
On October 15, global foundry leader TSMC (TSM) officially released its Q3 2026 financial report today. Single-quarter revenue and net profit both hit new record highs. However, impacted by macro liquidity tightening and concerns over sticky inflation and delayed rate cuts triggered by hotter-than-expected US September CPI data, its stock price fell by over 2% in pre-market trading, touching a low of $418 at one point and temporarily trading at $421.14.
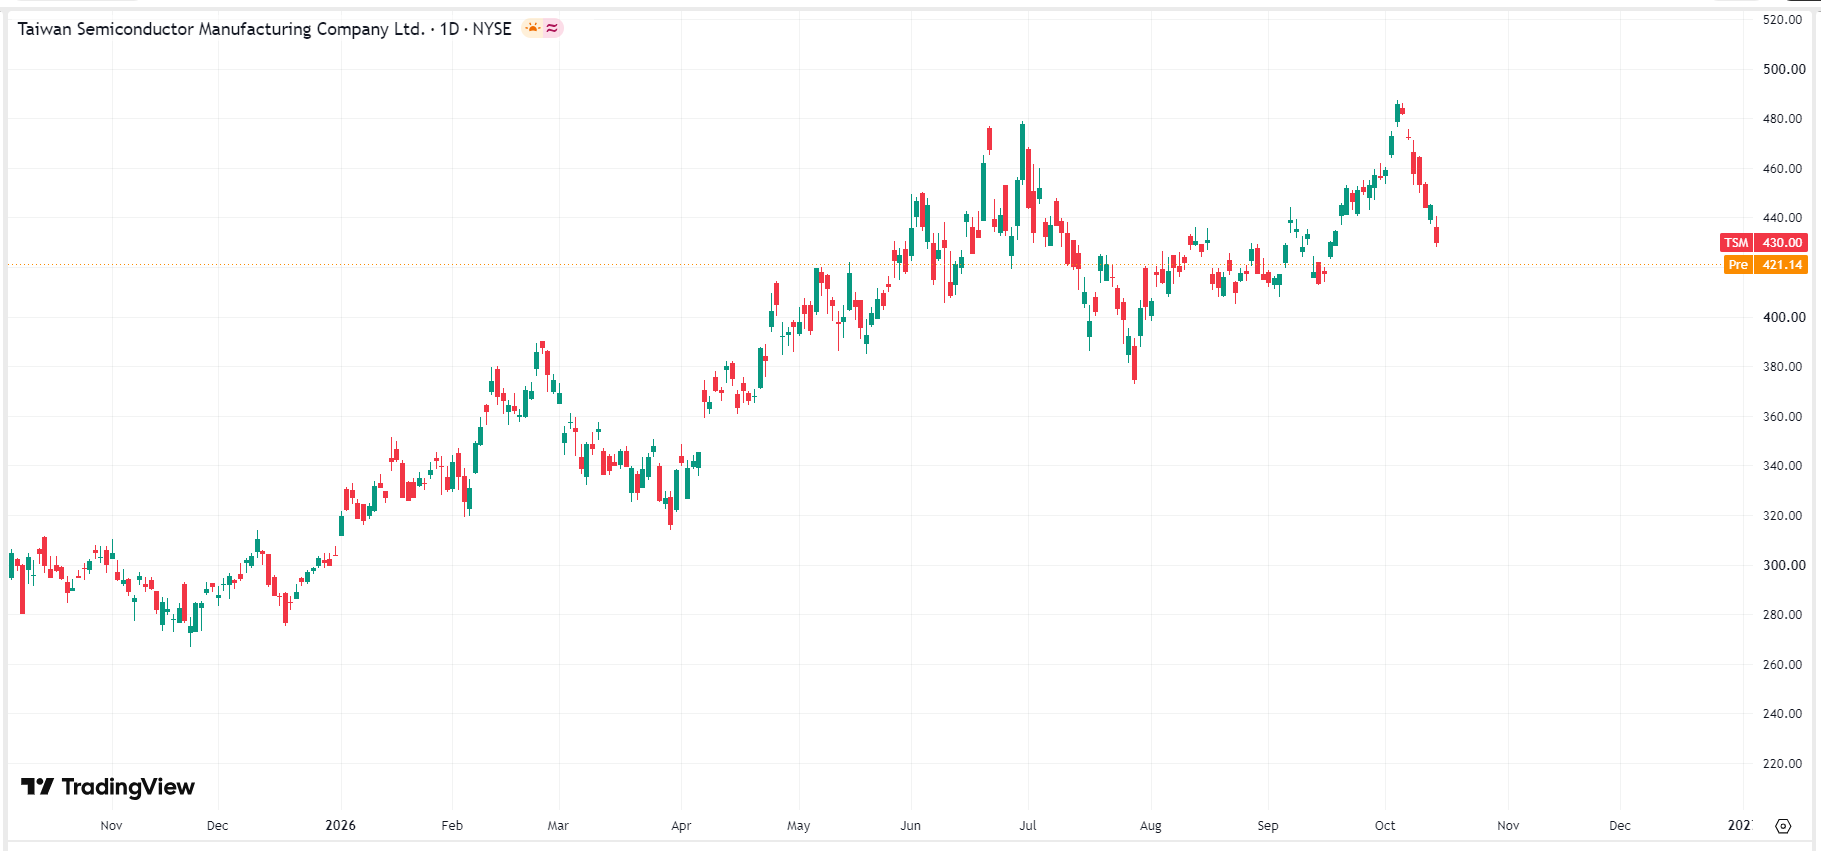 TSMC stock price chart, Source: TradingView
According to the latest financial report, TSMC's consolidated revenue reached NT$1.494 trillion (approximately $46.72 billion), a YoY surge of +50.9%, significantly topping market expectations of $45.62 billion. Single-quarter net profit after tax reached NT$763.06 billion, with earnings per share (EPS) surging to NT$29.43, up +68.7% YoY.
TSMC's Q3 financial results crushed Wall Street and market high expectations, demonstrating the ultimate profitability of the semiconductor monopoly leader. However, TSMC's better-than-expected performance could hardly offset the shock brought by the CPI. US September CPI rose 3.7% year-over-year, while core CPI rose 0.3% month-over-month. Sticky inflation heightened expectations of a Federal Reserve (Fed) rate hike in October, while jumping US Treasury yields directly suppressed the valuation premiums of high-beta tech stocks and semiconductor giants.
In pre-market trading today, semiconductor stocks continued their collective plunge, among which SK Hynix (SKHY) fell more than 6%, Micron (MU) fell over 4%, ASML (ASML) fell over 2%, and Nvidia (NVDA) fell over 1%. Under such selling pressure, TSMC inevitably faced sell-offs.
Currently, TSMC's ADR is trading in the $420–$430 range. If the broader market continues to suffer extreme macro liquidation, TSMC's stock price may decline toward the $400 psychological mark, which also serves as the strong high-conviction position base of the 120-day moving average and top institutions like Macquarie and Morgan Stanley. If the forward P/E ratio drops back to this level, it will trigger extremely strong value buying.
This content was translated using AI and reviewed for clarity. It is for informational purposes only.
Recommended Articles










Comments (0)
Click the $ button, enter the symbol, and select to link a stock, ETF, or other ticker.