


SpaceX Stock Price Forecast: Shares Fall below $160, Head-and-Shoulders Bottom Pattern May Form as New Rally Could Begin



AI Podcast


As of October 13 ET, SpaceX (SPCX) stock fell 4.21% to $156.54, slipping below its 10-day moving average. Despite weakened short-term momentum, the mid-term uptrend remains intact above the 20-day moving average. Technically, the stock is forming a potential head-and-shoulders bottom pattern, with key support at the $147 left shoulder. Sustaining this level could trigger a bullish breakout targeting $172 and $176.42, with potential upside toward $200. Conversely, dropping below $147 would invalidate the pattern, strengthening bearish momentum and risking a decline toward $140.

TradingKey - As of October 13 ET, SpaceX (SPCX) stock fell 4.21% to $156.54, hitting an intraday low of $156.05. The stock price has now dropped below the $160 mark and the 10-day moving average (around $161.16). However, it remains above the 20-day moving average (around $156) and is significantly higher than the 60-day moving average ($140.98), indicating that short-term momentum has weakened, but the mid-term rebound structure has not been broken.
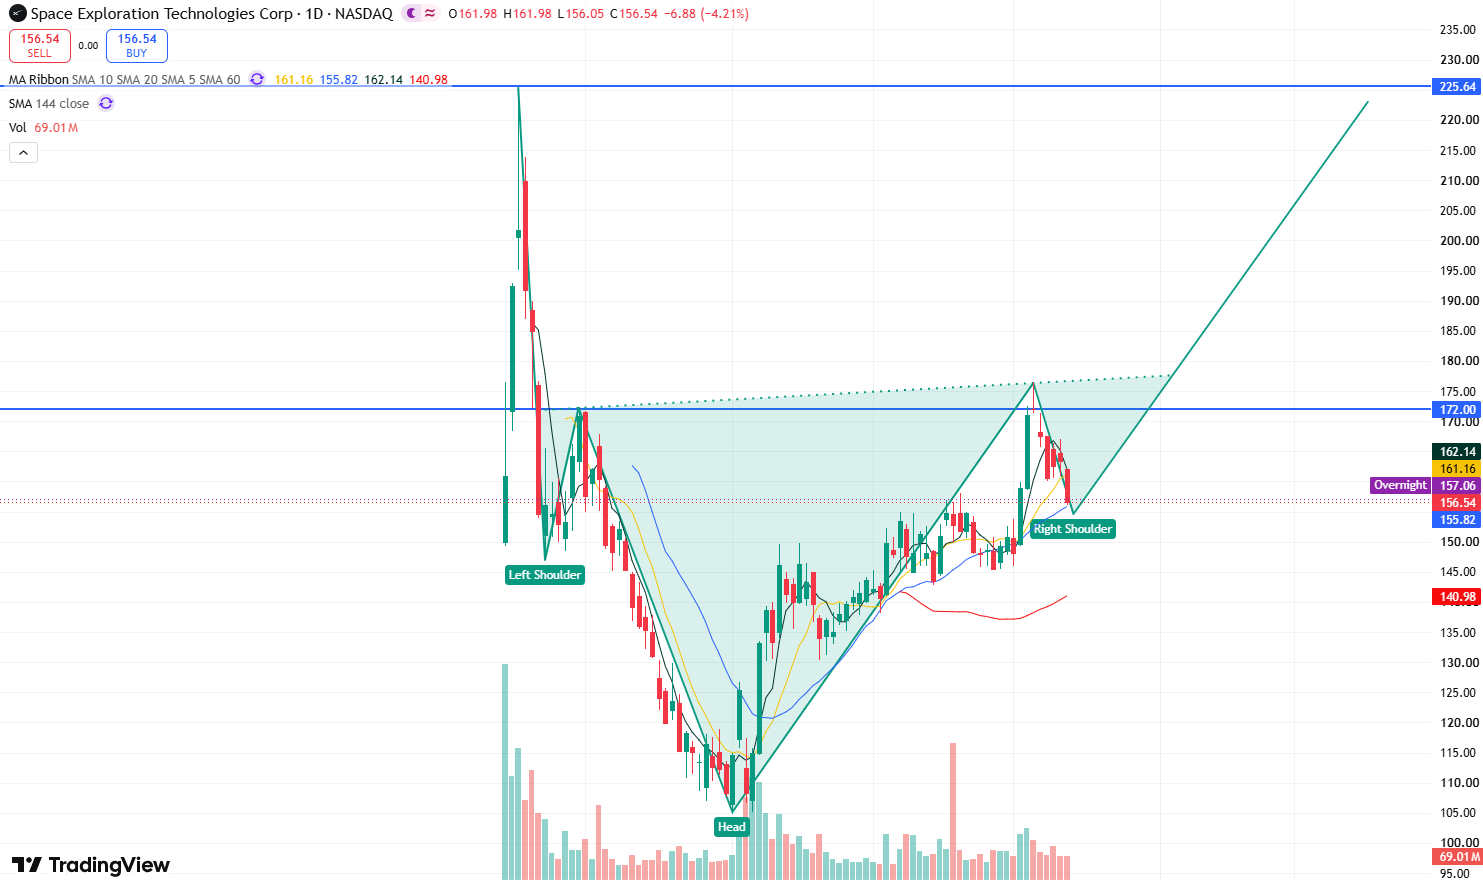
SPCX daily stock price chart, Source: TradingView
Meanwhile, technical patterns show that the daily candlestick structure of the stock price is forming a relatively clear potential head-and-shoulders bottom pattern. The left shoulder is located near the June 23 low of $147, and the head is at the all-time low of $104.83, while the recent pullback to around $156 increases the likelihood of forming the right shoulder. However, this pattern has not yet been officially confirmed, with the key being whether the stock price will break below the left shoulder of $147.
Currently, if the stock price shows signs of stabilizing above $147, its candlestick structure will form a head-and-shoulders bottom, strengthening short-term bullish momentum. The stock price may initiate a new round of increases, with the primary upside target being a break above the $172 neckline level, followed by the recent high of $176.42. If the stock price can break out and hold above this level, it will open up upside room toward $200.
Regarding support levels below, attention should first be paid to $156. If this level is lost, the stock price will further test the $150–$147 range. If the stock price falls below $147, bearish momentum will be significantly strengthened, potentially leading to a further drop toward the $140 mark.
This content was translated using AI and reviewed for clarity. It is for informational purposes only.
Recommended Articles












Comments (0)
Click the $ button, enter the symbol, and select to link a stock, ETF, or other ticker.