


Morgan Stanley Stock Forecast: $10 Trillion Asset Base Faces Q3 Test



AI Podcast


Morgan Stanley’s upcoming Q3 results on October 14 will test whether robust wealth management inflows and recurring fee growth can offset expected slowdowns in trading and dealmaking following record Q2 performance. The firm enters earnings with a strong $10 trillion combined asset base and solid capital ratios, though elevated private credit redemptions present fund-level liquidity challenges. Technically, shares trade near $186.64 within a symmetrical triangle demand zone. An RSI near 30 suggests weak momentum with potential for an oversold bounce. Investors should monitor wealth net new assets, trading revenues, and key technical levels, maintaining caution below the $193.10 resistance.

TradingKey - On October 13, shares of Morgan Stanley (NYSE: MS) closed at $186.64, down 1.78% and about 20% from its 52-week high of $232.25, set on July 15. The company is expected to report record breaking results from the second quarter.
What happens when trading and dealmaking starts slowing down? We’ll get a hint when Morgan Stanley reports Q3 results on October 14 before the bell. The company will host a conference call at 9:30 a.m.
Q2 Results Set an Exceptional Benchmark
During the second quarter of 2026, Morgan Stanley (NYSE: MS) earned a record $5.58 billion and EPS of $3.46. Return on Tangible Common Equity rose to 26.6%. With records being broken, will we see similar results in Q3?
The division of Morgan Stanley (NYSE: MS) that focuses on investment banking, recorded $2.44 billion in revenue for the quarter. Equities recorded a 69% increase from the prior year bringing revenue to $6.30 billion. Morgan Stanley (NYSE: MS) has a strong foothold in capital markets, and is among the last major U.S. banks to release Q3 results.
Wealth Management Anchors the $10 Trillion Story
Wealth Management revenue rose 14% to $8.86 billion in Q2 and delivered a 30.5% pre-tax margin. Segment client assets reached $8.08 trillion and were $2.0 trillion for Investment Management. Combined client assets topped $10 trillion.
The $10 trillion figure combines two divisions and encompasses some duplicated client assets. Separate fee-based Wealth Management client assets of $3.02 trillion support recurring revenue, and aren’t tied to market trading.
IPO-Related Inflows Make Q3 Asset Gathering Crucial
Net new assets in Wealth Management rose to a record $148.1 billion in Q2, of which Morgan Stanley reported that about 53% stemmed from IPO-related inflows from certain Workplace clients.
I would favor more broadly-based Q3 inflows and a stable 30%+ pre-tax margin over the IPO-driven record set in Q2. Wealth Management lending reached $195.7 billion.
Private Credit Redemptions Remain Elevated
Morgan Stanley's North Haven Private Income Fund received Q3 repurchase requests totaling 11.4% of units outstanding, down from 11.6% in Q2. The fund will repurchase 5% of units with approximately 43.8% of each investor's request satisfied.
This is a liquidity issue at the fund-level, not a firm-level cash situation. Elevated requests may concern other private credit fund investors and make new fund raisings more difficult, especially if investors want more stringent lending standards.
Investment Management Adds Recurring-Fee Growth
Revenues for Morgan Stanley’s Investment Management division climbed 6% in Q2 to $1.65 billion, driven by long-term inflows and higher levels of average assets under management (AUM). AUM totaled $2.00 trillion at the end of Q2 and net inflows were $7.5 billion. The unit is looking to further diversify its product offerings.
In September, the firm closed a $1.3 billion growth equity fund on attractive terms and announced a proposed conversion of approximately $10 billion of its muni mutual funds to ETFs. However, the conversion of the funds to ETFs is subject to a number of conditions and the assets should not be treated as completed transfers.
Capital Returns Provide Flexibility
In Q2, Morgan Stanley’s subsequently filed Form 10-Q indicated a standardized CET1 capital ratio of 14.9%; its initial press release estimated 14.8%. In addition, the firm bought back $1.5 billion of shares in Q2 at an average price of $197.64.
It raised its quarterly dividend to $1.15 and renewed its share repurchase authorization of up to $20 billion. Its shares are currently trading at $186.64. Shares fell slightly below its average share price during the quarter, however, its share repurchase program remains discretionary, dependent upon external factors such as market conditions and capital needs.
Q3 Earnings Are the Next Major Catalyst
FactSet estimates cited before the release forecasted revenue of $19.93 billion and EPS of $2.95. This would represent a sequential slowdown from Q2, however, not all of the company's business segments would need to exhibit deteriorating trends for the quarter for this to occur.
I am going to focus on the equity and fixed income businesses, deal fees, and wealth net new assets. I will also look at margin and share repurchases. If net inflows into wealth remain strong and public market trading holds up better than expected, I would feel better about the outlook. If there is weakness across markets and public wealth gathering, this would concern me.
Morgan Stanley Technical Analysis: $184.50 Tests the Triangle
Morgan Stanley (MS) closed October 13 at $186.64. Per the chart, $184.50 to $186.51 is a demand zone where ascending support meets descending resistance, forming a symmetrical triangle. Again, the chart-derived trendlines define a symmetrical triangle rather than a confirmed descending triangle.
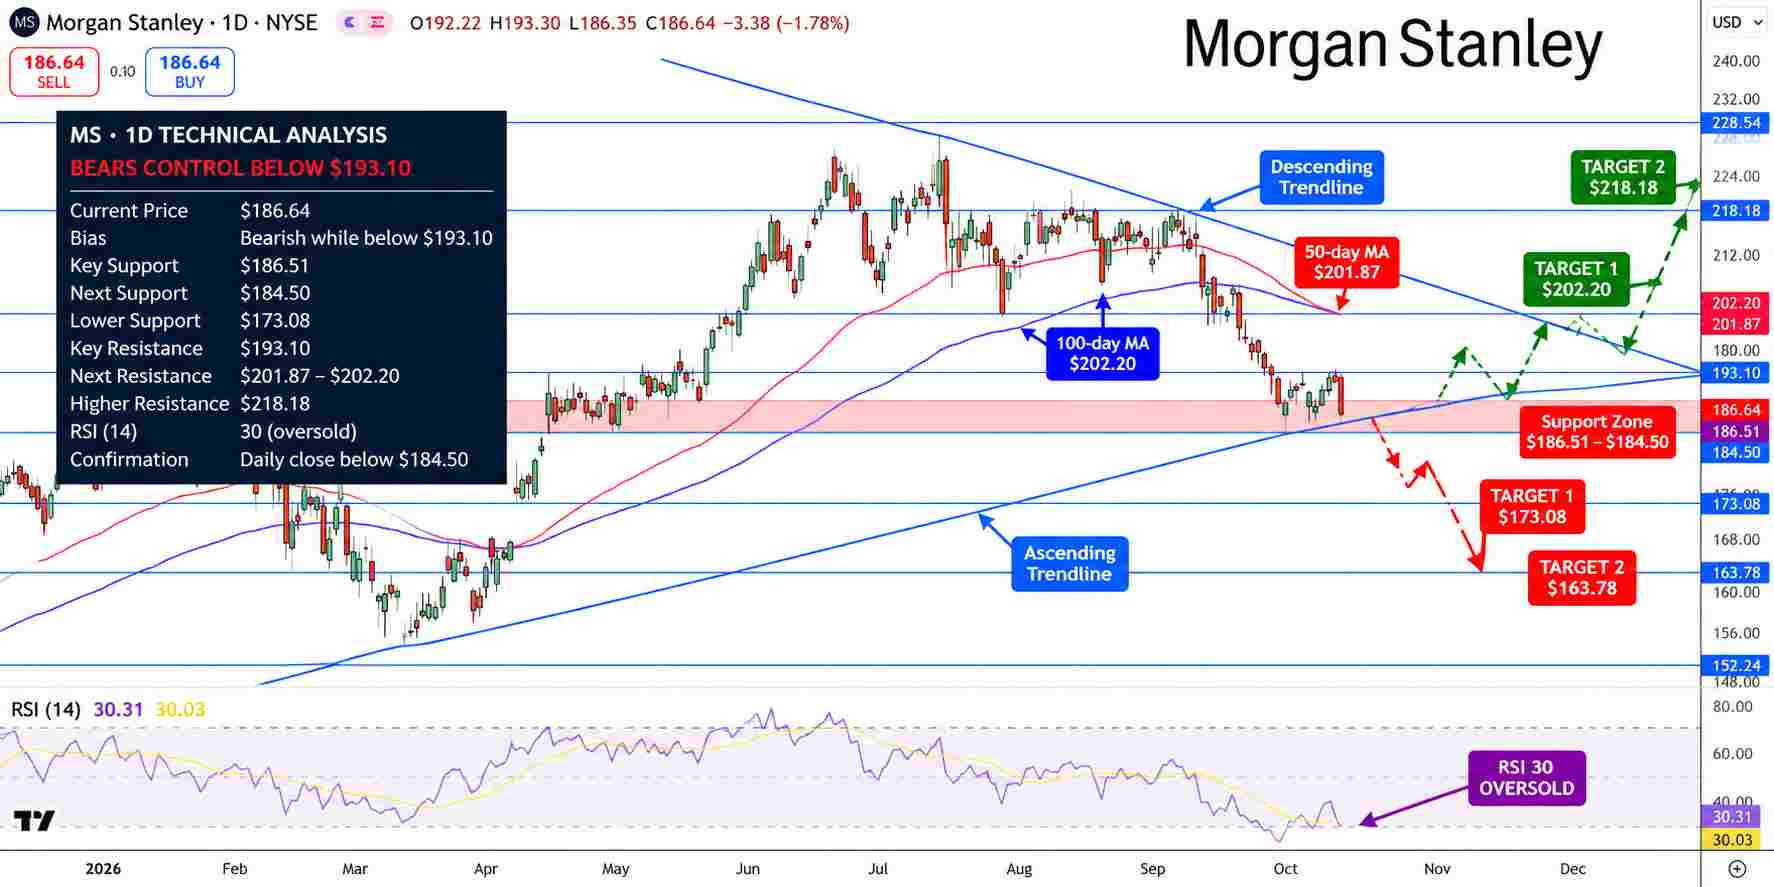
Morgan Stanley Stock Price Chart - Source: Tradingview
RSI at 30, close to its signal line, indicates that the momentum is weak and raises the likelihood of an oversold bounce, but not a confirmed reversal. With earnings in the picture, a daily close is imperative for confirmation.
MS remains bearish below $193.10. A close below $184.50 would expose the supplied support at $173.08 and potential support at $163.78. If demand zone defenders hold, a move up would take MS to the moving average and resistance area at $201.87 to $202.20. If that area is taken out, the outlook improves to $218.18. All chart levels beyond the confirmed close are supplied.
Key Levels
Latest Close: $186.64, October 13, down 1.78%
Support: $186.51 and $184.50; then $173.08 and $163.78
Resistance: $193.10; then $201.87 - $202.20 and $218.18
RSI: near 30 on supplied chart; not independently verified
Breakout trigger: sustained daily close above $202.20
Breakdown trigger: confirmed close below $184.50
FAQ: Why Is Morgan Stanley's $10 Trillion Asset Base Important?
It includes roughly $8.08 Trillion in Wealth Management client assets and roughly $2.0 Trillion managed or supervised in Investment Management, which helps supports fee revenue beyond trading.
FAQ: What Is MS Stock's Main Breakdown Level?
The main breakdown level on the provided setup is $184.50. A close below this level would put $173.08 in play on the downside.
Bottom Line
Morgan Stanley’s wealth franchise is the structural strength of the business, but Q3 must show that the normal inflows and trading can offset returns after a very strong Q2. I remain cautious below $193.10 and would reassess after earnings and a confirmed technical breakout.
Recommended Articles












Comments (0)
Click the $ button, enter the symbol, and select to link a stock, ETF, or other ticker.