


JPMorgan Stock Forecast: Strong Trading Faces Q3 Earnings Test Near $336



AI Podcast


JPMorgan Chase faces heightened market expectations ahead of its October 13 Q3 earnings release, following a record second quarter bolstered by one-time gains. Management projects mid-to-high teens year-over-year growth for investment-banking fees and Markets revenue, while raising its 2026 net interest income and expense outlooks. Strong capital positions and a new $50 billion share repurchase program support flexibility, though rising operating expenses and moderating trading revenues present primary risks. Technically, the stock maintains a bullish bias above $330.58, with a sustained close above $336.34 required to test September highs.
TradingKey - JPMorgan Chase (NYSE:JPM) closed at $334.30 on October 12, up 0.39%. The stock moved higher ahead of the company’s Q3 results. The stock faces a slight headwind as high trading and deal making expectations faces increased costs and a challenge from record 2Q results. JPMorgan will release results on October 13 at 7:00 a.m. ET. Expect a call at 8:30 a.m. ET.
Investment Banking and Trading Lead Expectations
Doug Petno, JPMorgan co-President, stated on September 15, that he expects mid-to-high teens year-over-year growth for investment-banking fees and Markets revenue for the third quarter. His comments follow 30% and 35% growth for banking fees and Markets revenue, respectively, for the second quarter. Equity Markets surged 86% for the quarter, while Fixed Income Markets rose 6%.
Positive deal flow for the period is also important to consider. Reuters also noted that, for the second quarter, six U.S. banks including JPMorgan, posted record trading revenues totaling approximately $51 billion, and are expected to moderate for the third quarter. Doug Petno’s comments reflect management’s expectations and are not based on reported results.
Record Q2 Earnings Included One-Time Gains
JPMorgan reported $21.2 billion in net income for the quarter with EPS of $7.70. Net income included a $4.6 billion pretax gain related to Visa shares, alongside other investment gains. Adjusting for significant items, net income for the quarter was $16.9 billion, or $6.14 per share.
Return on Tangible Common Equity (after tax) for the quarter was 29%. Excluding significant items, return on Tangible Common Equity (after tax) was 23%. Significant investment gains impacted the results and cannot be treated as recurring operating income. Adjusted results demonstrate the strength and profitability of the franchise.
Net Interest Income Supports the Outlook
JPMorgan’s net interest income, excluding markets, for the quarter was $23.7 billion, an increase of 4% from the prior quarter. Management increased its 2026 guidance for the measure to approximately $96.5 billion from $95 billion, and its total NII estimate to approximately $105.5 billion.
An increase in the 10 Year Treasury yield should increase the level of income on JPMorgan’s invested assets and also increase the cost of its deposits. The main concern for JPMorgan should be protecting net interest margins from negative pressures rather than increasing the average of reported loan balances.
Consumer Credit Remains Manageable
JPMorgan reduced its projected 2026 card net charge-off rate from 3.4% to 3.2%, following the results of the second quarter. JPMorgan’s Card Services charge-off rate for the quarter was 3.34%. Debit and credit card spending for the quarter increased by 10%.
Although growth in interest rates and inflation put additional pressure on vulnerable households, at that time, the results pointed to positive consumer activity.
Buybacks and Capital Strength Provide Flexibility
Effective July 1, JPMorgan authorized a $50 billion share repurchase program. The bank increased its quarterly dividend to $1.65 and set October 6 as the record date for the dividend payable October 31.
JPMorgan’s Q2 earnings presentation reported that the bank’s standardized CET1 capital ratio was 14.1%. Because of this ratio, the bank has the flexibility to make additional investments and distributions, assuming there are no unforeseen credit losses.
Rising Expenses Are the Main Operational Risk
After the second quarter, JPMorgan increased its 2026 outlook for expenses to $107.5 billion from $105 billion, saying the increase was due to greater business volume and higher compensation. Expenses will eventually catch up to revenue, and combined with weak trading, could reduce operating leverage.
JPMorgan is also continuing its investment in its coverage of the investment bank. Reuters reported Rob Sweeney as global chair of investment banking in October to help bolster its advisory business.
October 13 Earnings Will Test the High Bar
Consensus estimates provided by the Street show an estimate of $5.93 in EPS for the third quarter and $51.23 billion in revenue. This is compared with $5.07 EPS and $47.12 billion in revenue for the third quarter 2025. These estimates are external and are not JPMorgan estimates, and are subject to change.
I will be looking to see if net interest income was positively impacted by pricing. Also, how did credit quality impact the quarter? Did the firm effectively control expenses for the quarter? Looking at how banks trade, a solid quarter is likely; however, I am cautious if expenses rise.
JPMorgan Technical Analysis: JPM Tests $336.34 Resistance
JPM closed October 12 at $334.30 according to StockAnalysis, after trading between $333.55 and $336.34. It has bounced off the October 7 low of around $325.07, and has closed at $329.58, $331.42, and $332.99, in the following sessions. Monday’s close was a part of the sequence of recovering closes, and indicates improving short-term demand. However, the stock continues to trade below the late September’s levels.
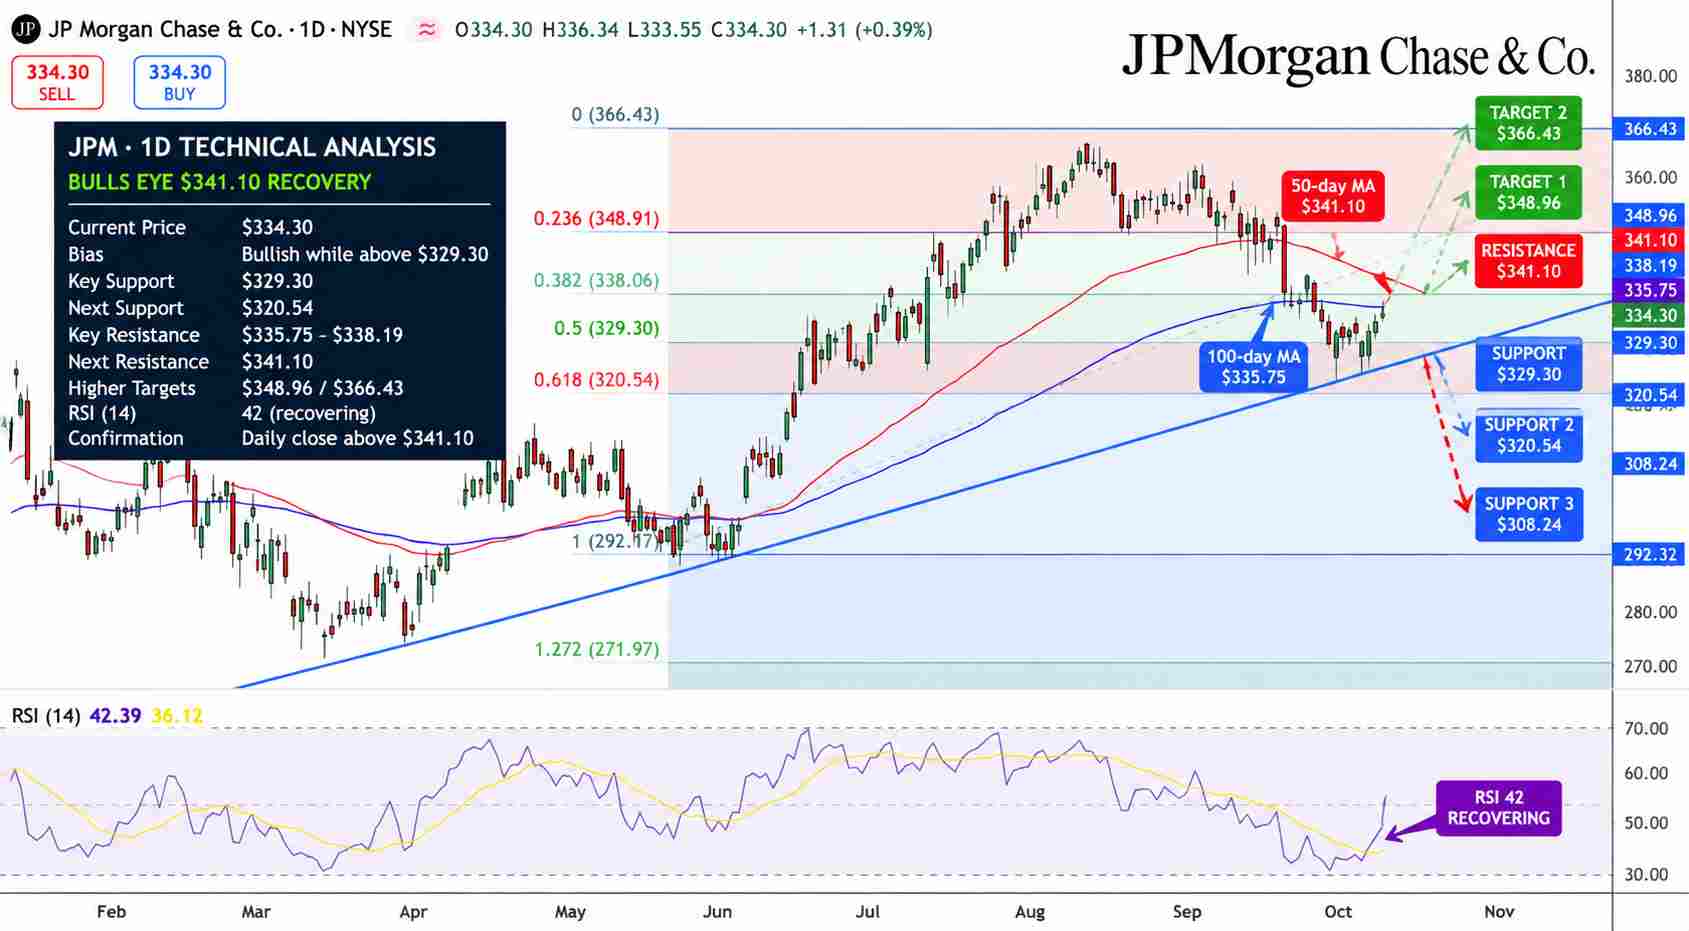
JPMorgan Stock Price Chart - Source: Tradingview
The draft’s RSI of around 42, the 100-day moving average around $335.75, and Fibonacci targets, cannot be verified with the limited and dated market-data feed. Moreover, an ascending trend-line also cannot be confirmed with a corresponding chart. Therefore, I consider the recovery to be price-driven. I don’t confirm claims for moving average or momentum signals.
My bias is to the upside as long as prices are above the October 9 low of $330.58. I would consider the recovery to have lost momentum if prices close below the October 9 low of $330.58. A sustained close above $336.34 would expose the September highs of around $341.44 and $343.31. $330.58 and $325.07 would provide support if the recovery weakened. Earnings gaps can overpower nearby chart support and resistance levels.
FAQ: Why Is JPMorgan Stock in Focus?
This quarter's earnings will test management's rosy outlook for the trading and deals businesses after an all-time record and largely gain-related Q2.
FAQ: What Is JPMorgan's Main Breakout Level?
The October 12 high at $336.34 is the next level of resistance. A break above that would bring $341 and $343 into focus next.
Bottom Line
JPMorgan's diversified business and strong capital positions provide a competitive edge. Elevated expense levels and increasing competition should be monitored. My bias is bullish above $330.58, but I'll need to see a break above $336.34 for a positive outlook on Q3.
Recommended Articles











Comments (0)
Click the $ button, enter the symbol, and select to link a stock, ETF, or other ticker.