


Goldman Sachs Stock Price Forecast: Q3 Revenue Far Exceeds Expectations, Rises Over 3% Pre-Market, Stock Expected to Return to $1,000



AI Podcast


On October 13 US Eastern Time, Goldman Sachs reported Q3 2026 net revenues of $18.68 billion and diluted EPS of $17.01, both beating expectations. Growth was primarily driven by a 32% increase in the Global Banking & Markets division, led by a 72% surge in equities trading revenue. Despite flat FICC performance and market volatility risks, the earnings beat drove pre-market gains, helping the stock reclaim key short-term moving averages. Initial resistance is eyed near $905–$913, with downside support located at $890–$895.
TradingKey - On October 13 US Eastern Time, Goldman Sachs (GS) reported its Q3 2026 financial results before the market open, with both revenue and earnings exceeding market expectations, and equity trading revenue surging 72% year-over-year. Following the report, GS rose over 4% in pre-market trading at one point.
Goldman Sachs Q3 Revenue Beats Estimates as Equity Trading Revenue Surges 72%
Goldman Sachs reported third-quarter net revenues of $18.68 billion, up 23% year-over-year and significantly above the FactSet consensus estimate of approximately $16.83 billion. Net income stood at $5.29 billion, up from $4.1 billion in the year-ago period. Diluted earnings per share reached $17.01, with an ROE of 18.7%.
By business segment, the primary growth driver this quarter was the Global Banking & Markets division, which posted revenue of $13.46 billion, up 32% year-over-year. Within the division, equities trading revenue reached $6.44 billion, surging 72% year-over-year, while Fixed Income, Currency, and Commodities (FICC) revenue fell about 1% year-over-year to $3.47 billion. Investment banking fees grew 21% year-over-year to $3.22 billion, reflecting continued revenue contributions from debt and equity underwriting as well as M&A advisory. Asset & Wealth Management revenue rose 14% year-over-year.
In terms of stock price impact, equities trading revenue and overall revenue topping market expectations served as the key data support for the pre-market gain. However, FICC revenue failed to achieve year-over-year growth. Furthermore, as an investment bank heavily focused on capital markets and trading operations, Goldman Sachs' future profitability remains subject to whether market volatility, IPO and debt underwriting, and M&A activity can maintain current levels. Following the earnings release, GS rose nearly 3% in pre-market trading at one point, indicating an initial positive price response from the market to the earnings beat.
Goldman Sachs Stock Price Technical Analysis
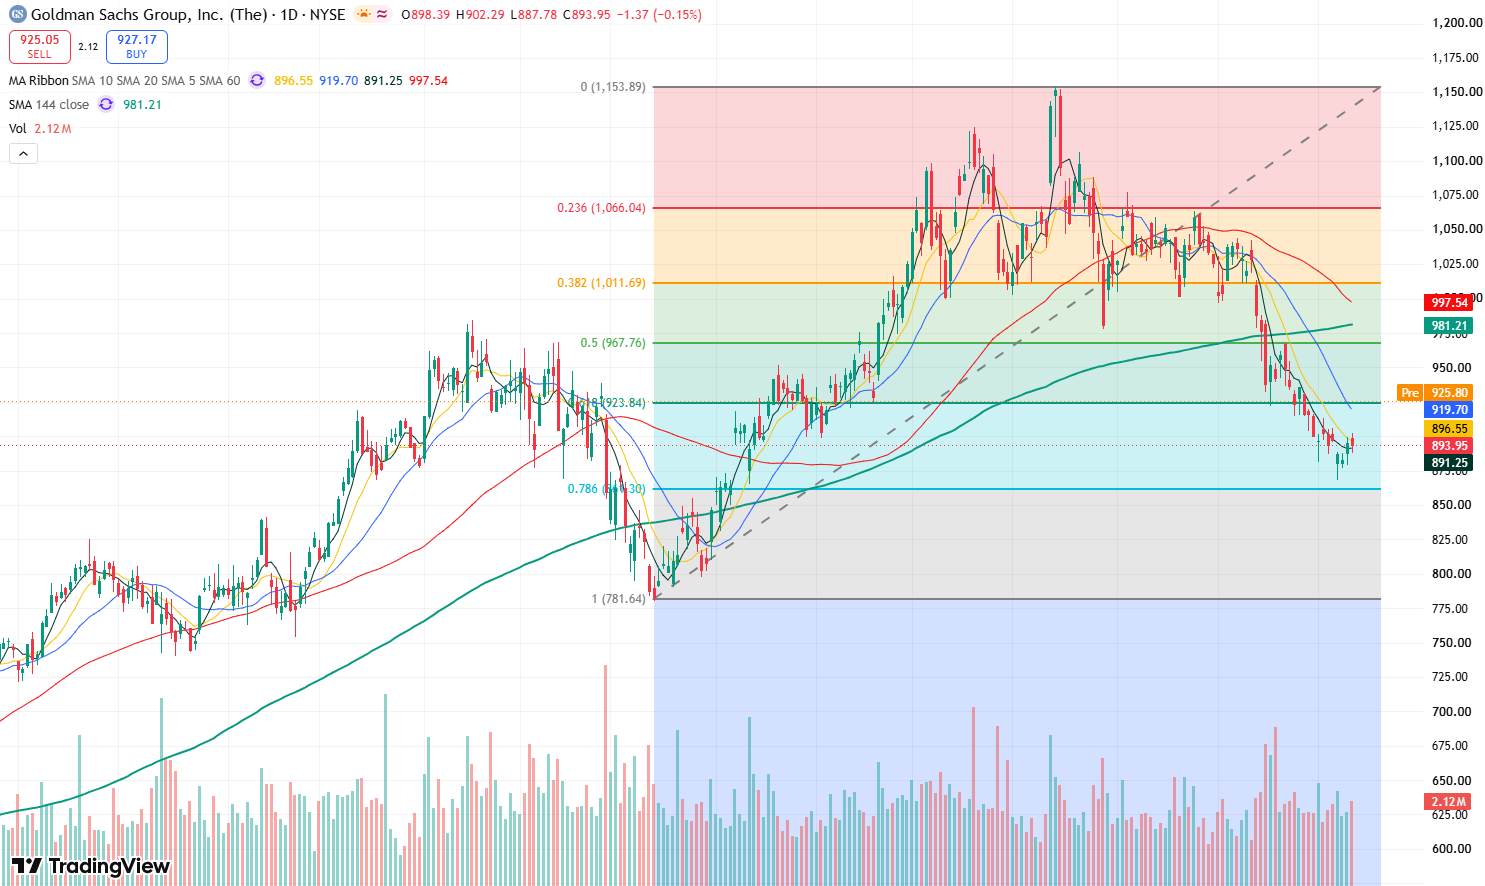
Goldman Sachs stock daily price chart, Source: TradingView
According to the daily chart of Goldman Sachs' stock price, the shares had previously undergone a continuous correction from their high, falling to a low of $868.52 on October 7 before gradually recovering over the following three trading days to close at $893.95 on October 12. After today's earnings report pushed pre-market shares back above $900, the price reclaimed the 5-day moving average of around $891.25, the 10-day moving average of $896.55, and the 20-day moving average of $919.70, indicating a strengthening in short-term bullish momentum.
On the upside, initial focus is on the $905–$913 region, where around $905 corresponds to the 100-day moving average and $913 represents the recent peak on October 2; if the post-earnings rally can push the stock price to hold firmly above $913, the next stage to observe is around $930, with further resistance in the $940–$950 range.
On the downside, initial support below is located at $890–$895, corresponding to multiple short-term moving averages; if it falls below again, attention will shift to near the recent low of $868.
This content was translated using AI and reviewed for clarity. It is for informational purposes only.
Recommended Articles











Comments (0)
Click the $ button, enter the symbol, and select to link a stock, ETF, or other ticker.