


Meta Stock Price Forecast: Muse Retention Nears ChatGPT, Morgan Stanley Raises Price Target to $920, Stock Poised for New Rally



AI Podcast


Meta’s AI assistant Muse demonstrates strong initial traction, achieving a 30% 7-day user retention rate and 2.8 million global downloads within two weeks of its September launch, trailing only ChatGPT. JPMorgan reaffirmed an "Overweight" rating and raised Meta's price target to $920, citing robust ecosystem expansion through Muse Connectors and massive long-term monetization potential. Technically, META trades above the critical $737.19 Fibonacci support level with upward-sloping moving averages, signaling a strong bullish trend toward testing recent highs of $779.80, while downside risks remain bounded above $681.24.
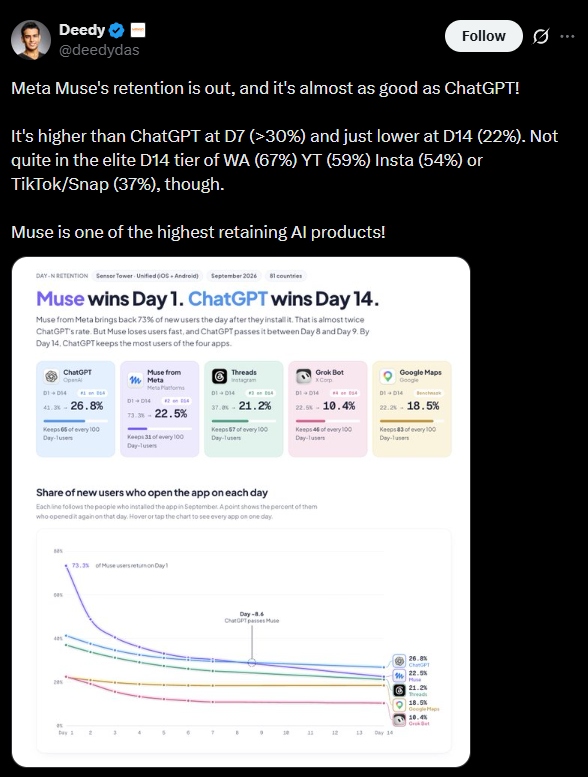
TradingKey - Renowned venture capitalist Deedy Das cited Sensor Tower data on X, stating that Meta (META)'s standalone AI assistant Muse, launched in September this year, has demonstrated strong user stickiness, with its user retention rate closely tracking market leader ChatGPT (OpenAI).
Data shows that Muse's 7-day user retention rate exceeded 30%, largely on par with ChatGPT, while its 14-day retention rate reached 22%, only slightly below ChatGPT. Although its retention rate remains lower than mature social applications such as WhatsApp (67%) and Instagram (54%), it performed remarkably well among standalone AI applications. In the first two weeks following its launch, Muse recorded 2.8 million global downloads, trailing only ChatGPT's 3.7 million over the same period, and significantly surpassing Grok (400,000) and Claude (300,000).
Source: X
On the other hand, JPMorgan recently released a research report stating that Muse's momentum continues to strengthen, reaffirming its "Overweight" rating on Meta and raising its price target from $820 to $920.
The firm noted that Muse Connectors has received over 2,000 applications, including integrations with Walmart, Best Buy, Sephora, and Wayfair, as Connectors help reduce friction and connect external websites, apps, and businesses. As tens of millions or even hundreds of millions of businesses come to have their own agents on Muse, interactions will increasingly occur on an agent-to-agent basis, allowing Meta to monetize through a cut or commission model, similar to its current ad monetization model.
The firm believes Muse has the potential to become the most widely used consumer AI application since ChatGPT, with a total addressable market potentially reaching tens of trillions of dollars.
Meta Weekly Chart, Source: TradingView
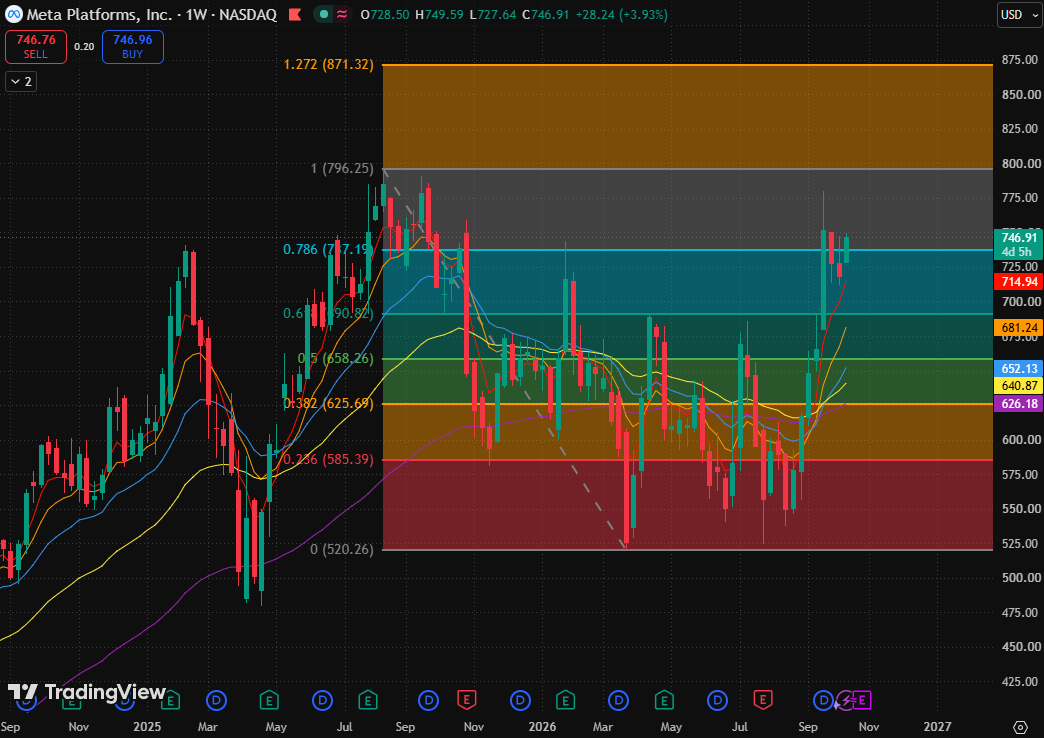
Looking at META's stock chart, the current price has returned above the key 0.786 Fibonacci retracement level ($737.19), representing a second upward assault following a sharp rally and subsequent pullback.
Previously, the stock price fluctuated repeatedly at high levels, rallied rapidly in September to break away from the moving average cluster, and then pulled back after hitting a high. The pullback weekly candlesticks over the past two weeks did not push the price back into the original consolidation zone, and this week's rebound indicates that the post-rally consolidation and recovery are ongoing.
Regarding moving averages, short-term moving averages are sloping upward, with the price positioned above all moving averages, signaling a strong trend.
As for upside potential, the weekly closing price needs to hold $737.19 for the second upward attack to continue; the next target price will be the recent high ($779.80). If it successfully converts this into a support level, the stock price is expected to head directly toward its all-time high ($796.25).
On the downside, $737.19 serves as the primary support and the most critical test at present. If the stock price convincingly breaks below this level, it is expected to find support in the range between the 0.618 Fibonacci retracement level ($690.82) and the 10-day moving average ($681.24), which was also the price zone prior to September's accelerated rally.
This content was translated using AI and reviewed for clarity. It is for informational purposes only.
Recommended Articles









Comments (0)
Click the $ button, enter the symbol, and select to link a stock, ETF, or other ticker.