


Johnson & Johnson Earnings Preview: Revenue Solid but Profit Under Pressure, Wall Street Sees Up to $320



AI Podcast


Ahead of its Q3 FY2026 earnings release on October 13 Eastern Time, Johnson & Johnson is projected to report solid revenue growth exceeding 5% year-over-year, driven by oncology drugs and MedTech recovery. However, adjusted EPS is expected to decline 3.9% to 5.0% due to roughly $1 billion in one-time M&A-related R&D expenses. Despite short-term profit pressure, major Wall Street institutions maintain bullish ratings with price targets reaching up to $320, reflecting confidence in its defensive profile, robust free cash flow, and long-term pipeline. Technically, the stock maintains a bullish structure, trading within a projected $240–$280 short-term range.

TradingKey - Johnson & Johnson Earnings Release Approaching: Solid Revenue Expectation Fails to Conceal Profit Pressure, but Wall Street Remains Broadly Bullish on Stock
On October 12 Eastern Time, healthcare giant Johnson & Johnson (JNJ) saw its stock price come under pressure ahead of its earnings release, dipping 0.26% in pre-market trading to $260.77. Tomorrow (October 13) before the U.S. market opens, Johnson & Johnson will officially report its Q3 FY2026 financial results. Will this drive its stock price higher?
As a bellwether for healthcare and defensive blue-chip stocks, Johnson & Johnson is widely expected by the market to report solid revenue growth overall in its upcoming earnings report, though profit faces slight pressure from M&A amortization. Driven by flagship oncology drugs and the recovery of the MedTech segment, revenue is expected to maintain solid growth of over 5%. However, adjusted earnings per share (EPS) may decline slightly, as Johnson & Johnson included approximately $1 billion in one-time R&D expenses in Q3 resulting from the acquisition of Firefly Bio and the collaboration with Sail Biomedicines.
According to Wall Street consensus estimates, the core highlights of Johnson & Johnson's Q3 FY2026 financial report may be as follows:
Key Metrics | Wall Street Consensus Forecast | Prior-Year Period (Q3 2025) | Expected YoY Growth |
Revenue | $25.36 Billion – $25.40 Billion | $24.00 Billion | +5.4% to +5.8% |
Adjusted EPS | $2.45 – $2.66 | $2.77 | -3.9% to -5.0% |
Although short-term EPS may decline due to R&D amortization, Wall Street institutions remain highly confident in Johnson & Johnson's medium-to-long-term prospects. Top investment banks generally maintain Buy / Moderate Buy ratings, with price targets as high as $320, detailed as follows:
Institution | Latest Price Target | Core Views and Highlights |
HSBC / UBS Group | $320.00 | Recognizes the strong free cash flow of Johnson & Johnson's defensive assets and its new drug pipeline succession capability after 2027. |
Goldman Sachs | $305.00 | Bullish on the recovery of MedTech and strong revenue driven by heart pumps. |
Bank of America | $303.00 | Believes the market has priced in short-term EPS downward revisions caused by M&A R&D expenses, maintaining a bullish outlook. |
Morgan Stanley | $294.00 | Diversified product portfolio, with limited long-term impact from the patent expiration of Stelara. |
Citi | $290.00 | Oncology drug growth exceeded expectations; defensive blue-chip stocks offer strong appeal amid macroeconomic volatility. |
Wells Fargo | $282.00 | Demand in medical devices and cardiac rhythm management sectors continues to improve. |
From a technical analysis perspective, Johnson & Johnson's stock price maintains a bullish structure and may continue to fluctuate in the $240–$280 range in the short term. If the upcoming earnings report generally aligns with or exceeds market expectations, the stock price will likely trend higher with volatility. Conversely, if results miss market expectations, the stock price may retest the July low of $245, and in an extreme worst-case scenario, could drop to this year's low of $220.
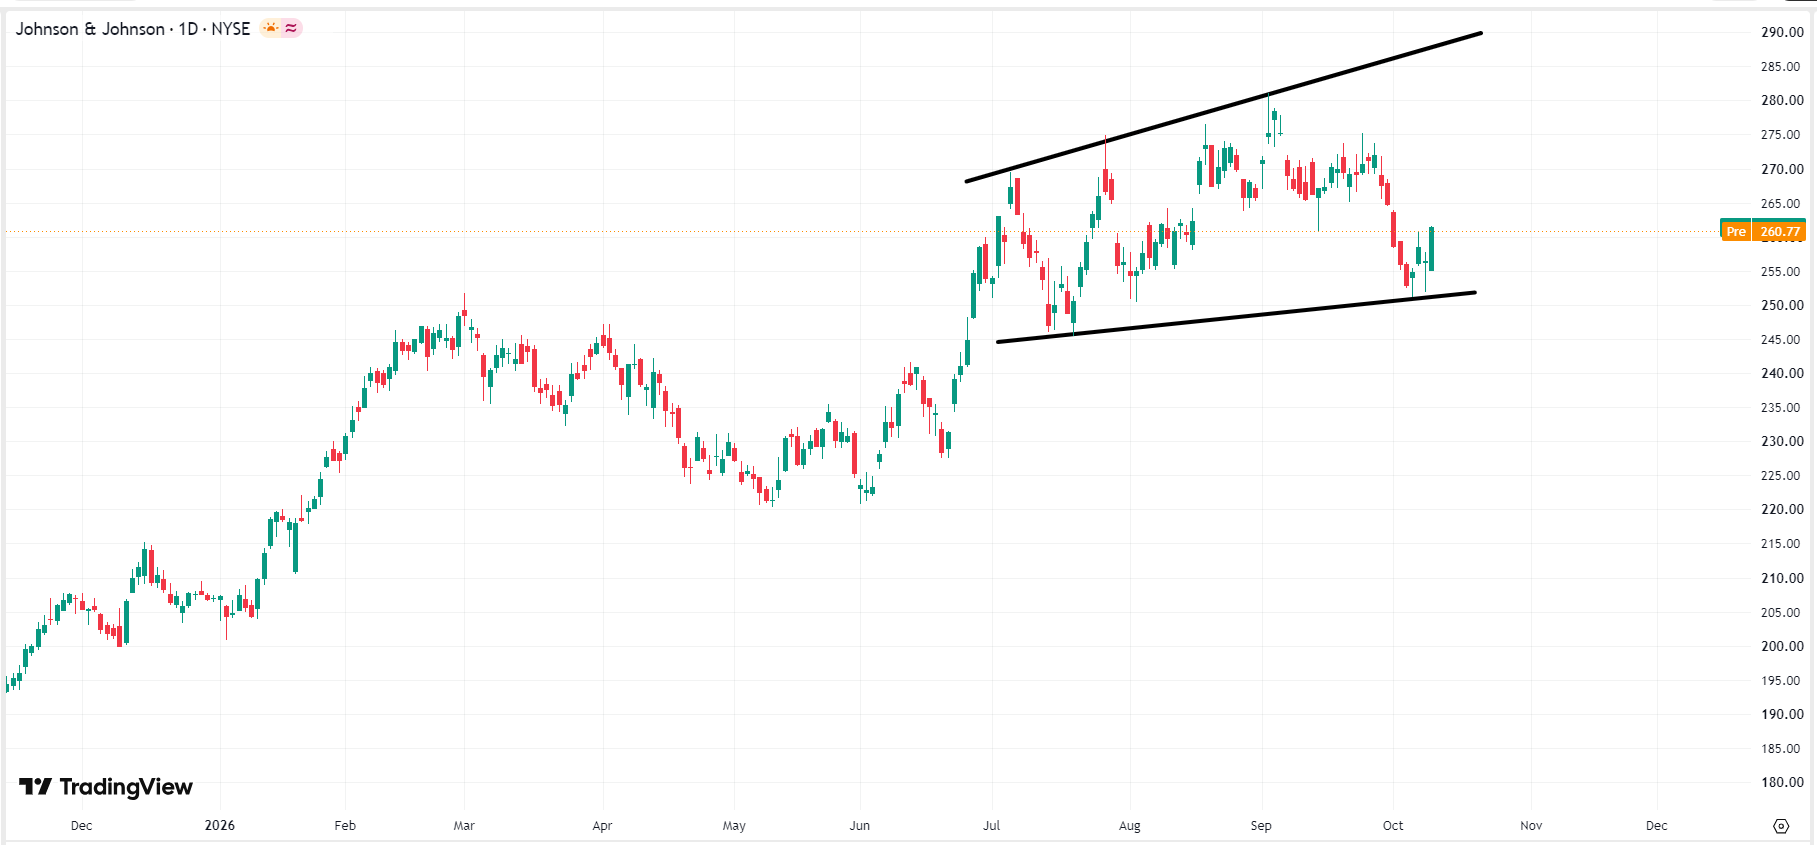 Johnson & Johnson stock price chart, Source: TradingView
This content was translated using AI and reviewed for clarity. It is for informational purposes only.
Recommended Articles










Comments (0)
Click the $ button, enter the symbol, and select to link a stock, ETF, or other ticker.