


T-Mobile Stock Forecast: SpaceX Mobile Threat Tests a Strong Wireless Growth Story



AI Podcast


T-Mobile US reported strong Q2 financial fundamentals, including a 9% year-over-year increase in service revenue to $19.0 billion and raised 2026 free cash flow guidance. However, the stock fell 13.27% following SpaceX’s agreement to acquire 800 MHz spectrum, introducing long-term competitive concerns regarding Starlink Mobile. Meanwhile, T-Mobile, AT&T, and Verizon formed a joint venture for satellite connectivity. Technically, TMUS remains bearish below the $161.09 resistance level, testing crucial support near $148.02. Upcoming Q3 earnings and management commentary on SpaceX will serve as critical catalysts for the stock's direction.
TradingKey - As T-Mobile US (TMUS) entered the week ended October 9 with strong Q2 operating numbers, it faced a new strategic risk. TMUS closed at $148.58, down 13.27% after SpaceX reached an agreement to acquire the nationwide 800 MHz spectrum from Grain Management.
SpaceX Spectrum Deal Changes the Competitive Debate
On October 8, SpaceX reached an agreement to acquire up to 14 MHz of paired spectrum in the 800 MHz band from Grain Management for approximately $8 billion. The transaction is subject to regulatory approval, but low-band spectrum is attractive because signals can cover greater distances and can penetrate walls and other obstructions.
Low-band spectrum provides wider coverage, but terrestrial service still requires significant network infrastructure. The low band spectrum SpaceX agreed to purchase allows for the further development of Starlink Mobile and makes the hybrid satellite/terrestrial network more of a near-term reality.
T-Mobile's partnership with SpaceX to use Starlink to provide service to people outside the terrestrial network leaves SpaceX both a current partner and potential future competitor.
Carriers Build Their Own Satellite Defense
Announced on October 1, T-Mobile, AT&T, and Verizon entered into a joint venture agreement to develop satellite connectivity. Additionally, the companies announced Paul Roth as the interim CEO of the joint venture. The joint venture will help the companies use their spectrum resources to offer connectivity in areas where their terrestrial (land-based) networks do not reach.
The joint venture will not impact the companies’ existing satellite agreements. As such, T-Mobile’s agreement with Starlink will remain in place.
Q2 Fundamentals Remain Strong
T-Mobile continues to be in a strong financial position. Service revenue for Q2 increased 9% year over year to $19.0 billion. Postpaid service revenue increased 13% to $15.9 billion. Core Adjusted EBITDA increased 12% to $9.5 billion.
Strong financial and operating results were reflected in strong cash flow metrics. Net income increased 1% to $3.2 billion, diluted EPS increased 5% to $2.99, operating cash flow increased 7% to $7.5 billion, and adjusted free cash flow increased 4% to $4.8 billion. Postpaid ARPA increased 2% to $152.91.
Subscriber Growth Faces a Temporary Test
T-Mobile added 277,000 net postpaid accounts in Q2, 13% lower than last year, and postpaid account churn was 0.99%. Management expects approximately 250,000 net postpaid account additions for Q3, with customers migrating to more expensive plans, contributing to the lower additions. Reuters reported analysts’ expectations to be at 304,000.
With more customers switching to higher-tier, more expensive plans, average revenue per account (ARPA) is expected to increase in the near term, but at the expense of customer additions. Management noted that over 60% of customers on new accounts are choosing higher-tiered plans. The October results report will indicate whether more higher-tiered customers offset fewer total customers added.
Free Cash Flow Guidance Was Raised
T-Mobile revised their 2026 adjusted free cash flow (FCF) guidance to a range of $18.4 billion to $18.8 billion from the previous range of $18.1 billion to $18.7 billion. Operating cash flow (OCF) guidance is revised to a range of $28.4 billion to $28.8 billion from a previous range of $28.1 billion to $28.7 billion. Core Adjusted EBITDA is expected to be in the range of $37.1 to $37.5 billion.
Capital expenditures (CapEx) for the year are projected to be approximately $10.0 billion. During Q2, the company spent $2.2 billion on share repurchases and paid $1.1 billion in dividends.
Network Quality Remains the Main Defense
In Q2, T-Mobile announced record wireless Net Promoter Score of 46, and continued to publicize accolades from Ookla, Opensignal and P3.
Owning spectrum alone does not create a nationwide consumer mobile network. SpaceX would still need a large amount of terrestrial infrastructure (radio, antennas, towers, backhaul, etc.) to match performance of established carriers in urban markets.
October 28 Earnings Become the Next Test
T-Mobile will release Q3 results on Wednesday, October 28. The financial materials are scheduled to be released at approximately 4:05 pm ET, followed by the earnings call at 4:30 pm ET.
I’m interested in postpaid net additions, postpaid churn, ARPA, service revenue and adjusted free cash flow. I’m also interested in management’s comments regarding SpaceX. I’ll be watching negative signs for SpaceX and its impact on T-Mobile’s capex. I want to see evidence that T-Mobile’s premium plan migrations are boosting ARPA without increased churn. I don’t want to see evidence that SpaceX’s entry is forcing T-Mobile to increase network spending. I also don’t want T-Mobile to find ways to sever its relationship with SpaceX’s Starlink.
T-Mobile Technical Analysis: $148.02 Support Faces a Critical Test
T-Mobile declined $22.73 or 13.27% to close at $148.58 and pierced the $161.09 support level. The larger pattern is bearish as the price is below both the moving averages and trendlines. On the other hand, T-Mobile has moved to the $148.02 support area.
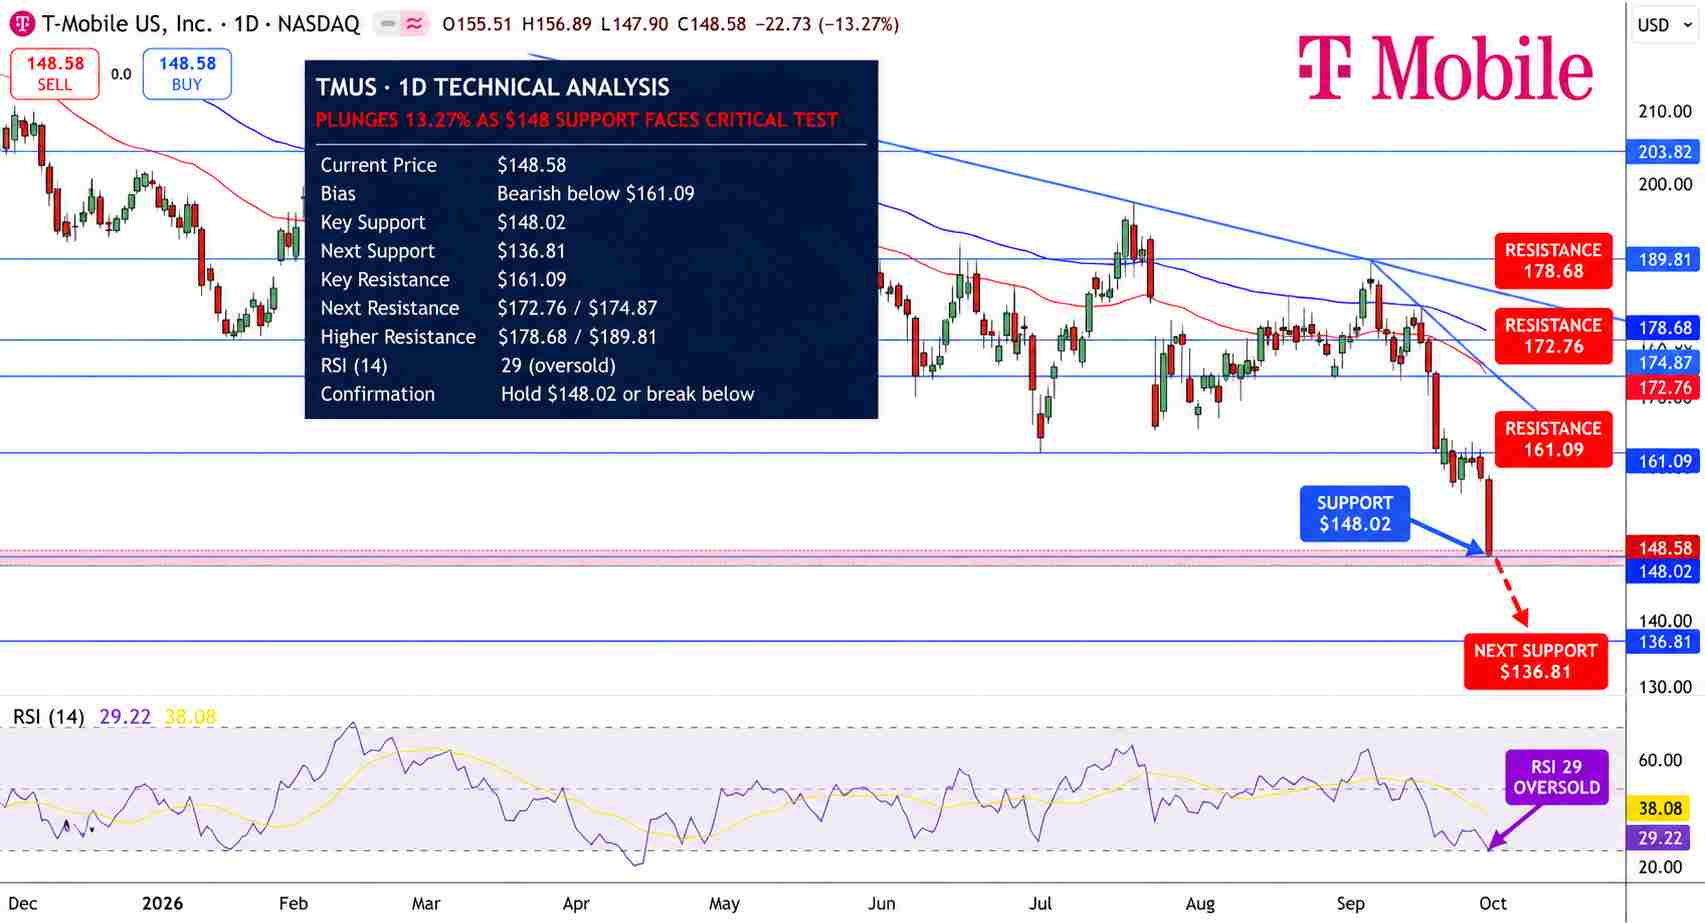
T-Mobile Stock Price Chart - Source: Tradingview
The Relative Strength Index is at 29, and below the 38 level which indicates selling pressure, and oversold conditions.
A close below $148.02 would further validate lower prices and target $136.81. $161.09 is the first resistance area, followed by the 50-day moving average at $172.76 and the resistance area at 174.87-178.68.
I will maintain a bearish view as long as prices trade below $161.09, and $148.02 is providing support and may spur a minor bounce. A recovery above $172.76 is needed to improve the broader trend.
Key Levels
Latest completed close: $148.58
Major support levels: $148.02, $136.81
Major resistance levels: $161.09, $172.76, 174.87-178.68
RSI: Around 29
Recovery/breakout trigger: Sustained recovery above $172.76
Breakdown trigger: Sustained daily close below $148.02
FAQs
Why is T-Mobile stock in focus now?
T-Mobile has been in the spotlight because of SpaceX’s planned $8 billion purchase of nationwide 800 MHz spectrum, making Starlink Mobile a more credible long-term competitive threat. This caused a 13.27% single-day decline in TMUS.
What technical level would confirm a stronger T-Mobile recovery?
T-Mobile’s longer-term trend would improve considerably with a move above $172.76. Before that happens, however, TMUS has to recover above $161.09, and a close below $148.02 would confirm the prior downtrend and keep the focus on $136.81.
Bottom Line
T-Mobile’s near-term fundamentals are healthy with rising service revenue, EBITDA, average revenue per account (ARPA) and adjusted free cash flow, but the SpaceX spectrum deal has altered the competitive landscape, at least, in the longer-term. Currently, Starlink Mobile doesn’t present a nationwide substitute for T-Mobile and the spectrum deal still needs FCC approval. From a tech vantage point, TMUS is bearish as long as it trades below $161.09, and $148.02 has make-or-break support.
Recommended Articles











Comments (0)
Click the $ button, enter the symbol, and select to link a stock, ETF, or other ticker.