


Costco Stock Forecast: Q4 Earnings Could Decide COST’s Next Major Move



AI Podcast


Costco enters its fiscal fourth quarter 2026 earnings release with strong reported sales of $93.9 billion, driven by robust digital growth and high membership renewal rates. Investors will closely monitor profitability metrics, including gross margins, expense control, and membership fee trends, to justify the stock’s high valuation multiple. Technically, COST trades cautiously below the $903.32 descending-channel resistance, with immediate support at $889.56. A stronger-than-expected financial report could catalyze a breakout toward the $918.48–$920.05 resistance zone, whereas margin compression or weaker execution risks extending the current downside momentum.
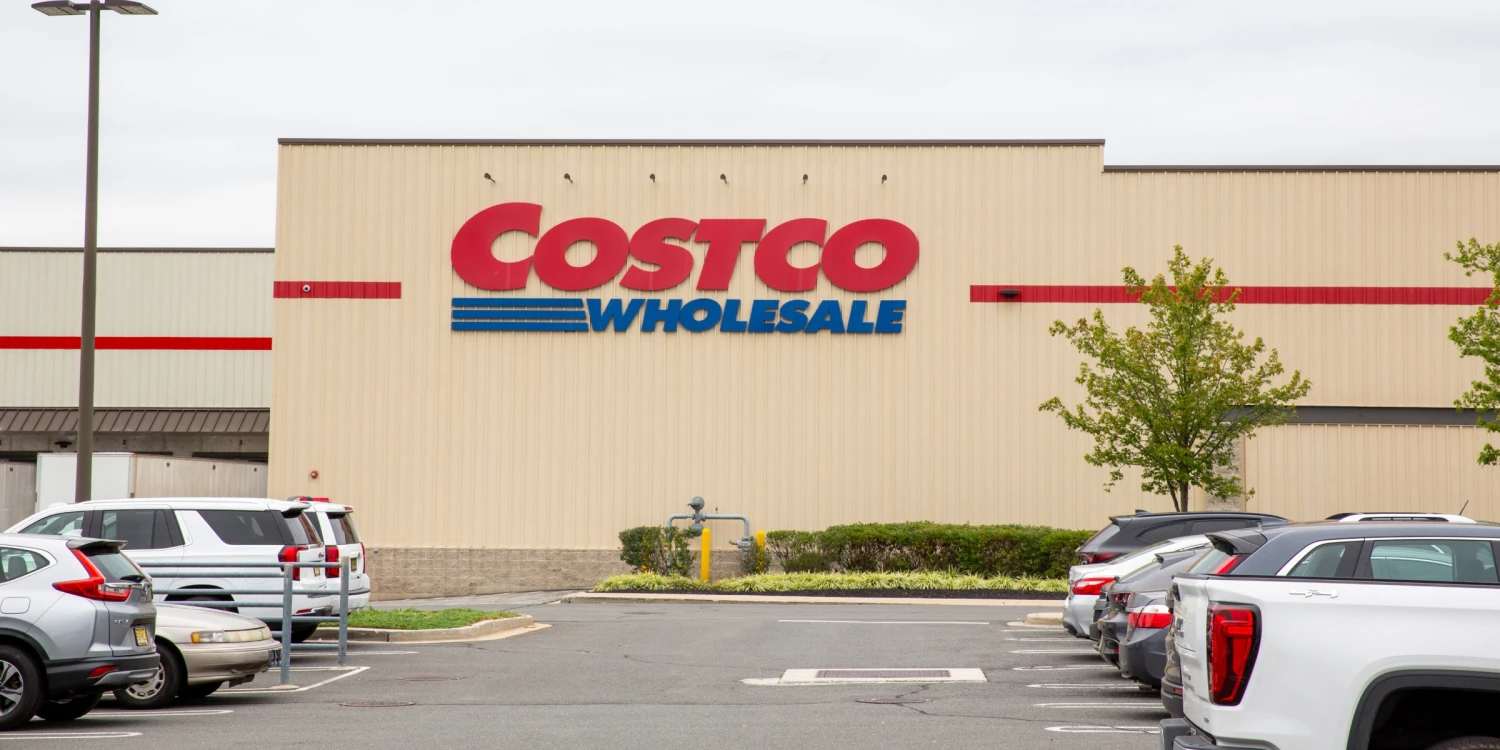
TradingKey - Costco (NASDAQ: COST) will release its fiscal fourth quarter 2026 results on Thursday, and provide an update on its business during an earnings conference call that same day at 2 PM PT (21:00 GMT). While Wall Street will be tracking Costco’s sales results for the quarter to confirm membership renewals and shopping trends, the company is expected to have already benefited from those and captured the information in its financials. Changes in membership renewals, merchandise margins, and cost control are likely to impact COST in the near term.
Q4 Sales Are Strong, but the Earnings Story Is Incomplete
Costco reported sales of $93.9 billion for the 16-week fourth quarter ended August 30, 2026, an increase of 11.3% from the prior year quarter.
Company-wide, total sales rose 9.4% on a comparable basis. Adjusted sales, which exclude the effect of gasoline and foreign exchange rates, rose 6.7% for the quarter. Sales in the U.S. rose 10.7% on a comparable basis.
Digital sales rose 19.5% for the quarter.
Comparable sales results, while positive, may not be as meaningful as margins and expenses, which will be reported along with financial results for the 16-week fourth quarter ended August 30, 2026.
Membership Is the Most Important Q4 Test
Costco's continuous membership model is a strong competitive edge and rising membership fees strengthens the company's financials.
Q3 membership revenue was $1.37 billion, up from $1.24 billion a year prior. The number of paid memberships grew by 4.1%, to 82.9 million. Executive memberships grew to 41.2 million.
Membership renewals were at 92.2% in the U.S. and Canada and 89.7% worldwide.
Although membership growth was less than the growth in merchandise sales, the model is successful due to high renewal rates. With renewal rates at almost 90%, there is not a strong need to increase membership to grow sales. With the rates and trends mentioned, Thursday's membership report is important.
Given recent sales, it is likely Costco has positively impacted and strengthened customer relationships. Thursday's report should confirm positive relationships and support recent sales growth.
Margins May Decide the Stock Reaction
The sales growth in Q3 was supported by a 6.6% increase in adjusted total-company comparable sales excluding gasoline and foreign exchange effects. Diluted EPS was $4.93 for the quarter.
Q4 adjusted comparable sales were already reported at 6.7%, very close to Q3's 6.6% rate.
The main focus for investors should be profitability. Gross margins declined by 21 basis points, but were up 1 basis point after adjusting for the impact of gasoline-price inflation.
The main question for Costco's Q4 report is if gross margins, operating expenses and other costs remain under control and in line with sales growth.
August Was Slower, but the Calendar Matters
Costco reported a 5.4% increase in its adjusted comparable sales for August, compared to the 6.7% increase for the full fourth quarter.
I don’t think August sales merit consideration of a broad-based slowdown.
Costco said the later timing of Labor Day this year reduced August sales by about three-quarters of a percentage point.
The impact of the calendar on August sales provides a basis for evaluating management’s comments on the expected trends for the upcoming fiscal year.
Digital Growth Remains a Structural Positive
For the quarter and year ended August, Costco reported year-over-year increases of 19.5% and 20.9%, respectively, in digital-enabled comparable sales.
Costco continues to enhance its member discount program by adding more convenience to members’ lives and deepening engagement, which has the added benefit of improving member satisfaction and further aligning with the core value of Costco’s warehouse store business model.
The core model of Costco is to offer lower prices to members. For members to receive a discount on the goods purchased, Costco incurs the costs of fulfillment. If digital sales increase and satisfy members at warehouses, Costco’s model achieves its goal of offering even greater value to members. Increasing gross margins as a result would stabilize the model even more.
The Valuation Still Demands Strong Execution
Costco’s current price of $899.41 per share values the business at a higher multiple than the average retail stock.
Growing member renewals and favourable store traffic drives comparables.
Costco’s core membership model provides a recurring revenue stream.
At $899.41, Costco trades at roughly 45 times trailing earnings and about 41 times forward earnings. The bar is set high and expectations are great. If the stock trades at these levels, future results had better be great.
What Would Strengthen the Bull Case
Costco reporting positive membership trend, fee collection, and EPS with margins in an expected range would reinforce my view.
I would be more negative with surprising negative trends in membership, fee collection and/or if margins compressed due to poor sales.
Membership trends and collections are positive sign posts but Thursday's report needs to show that Costco is capturing and benefitting from that demand.
Costco Technical Analysis: COST Tests $903.32 as Descending Channel Caps Recovery
Costco’s recent closing price is $899.41 almost exactly cost the chart price of $899.50. The 2-hour structure remains cautious after the rebound from $889.56, with price still below the descending-channel ceiling near $903.32. Tuesday’s close placed price just under the upper channel line of the descending channel at $903.32, a level that should provide strong technical resistance. If price breaks and holds above this level a move to the next major resistance at 918.48-920.05 is likely.
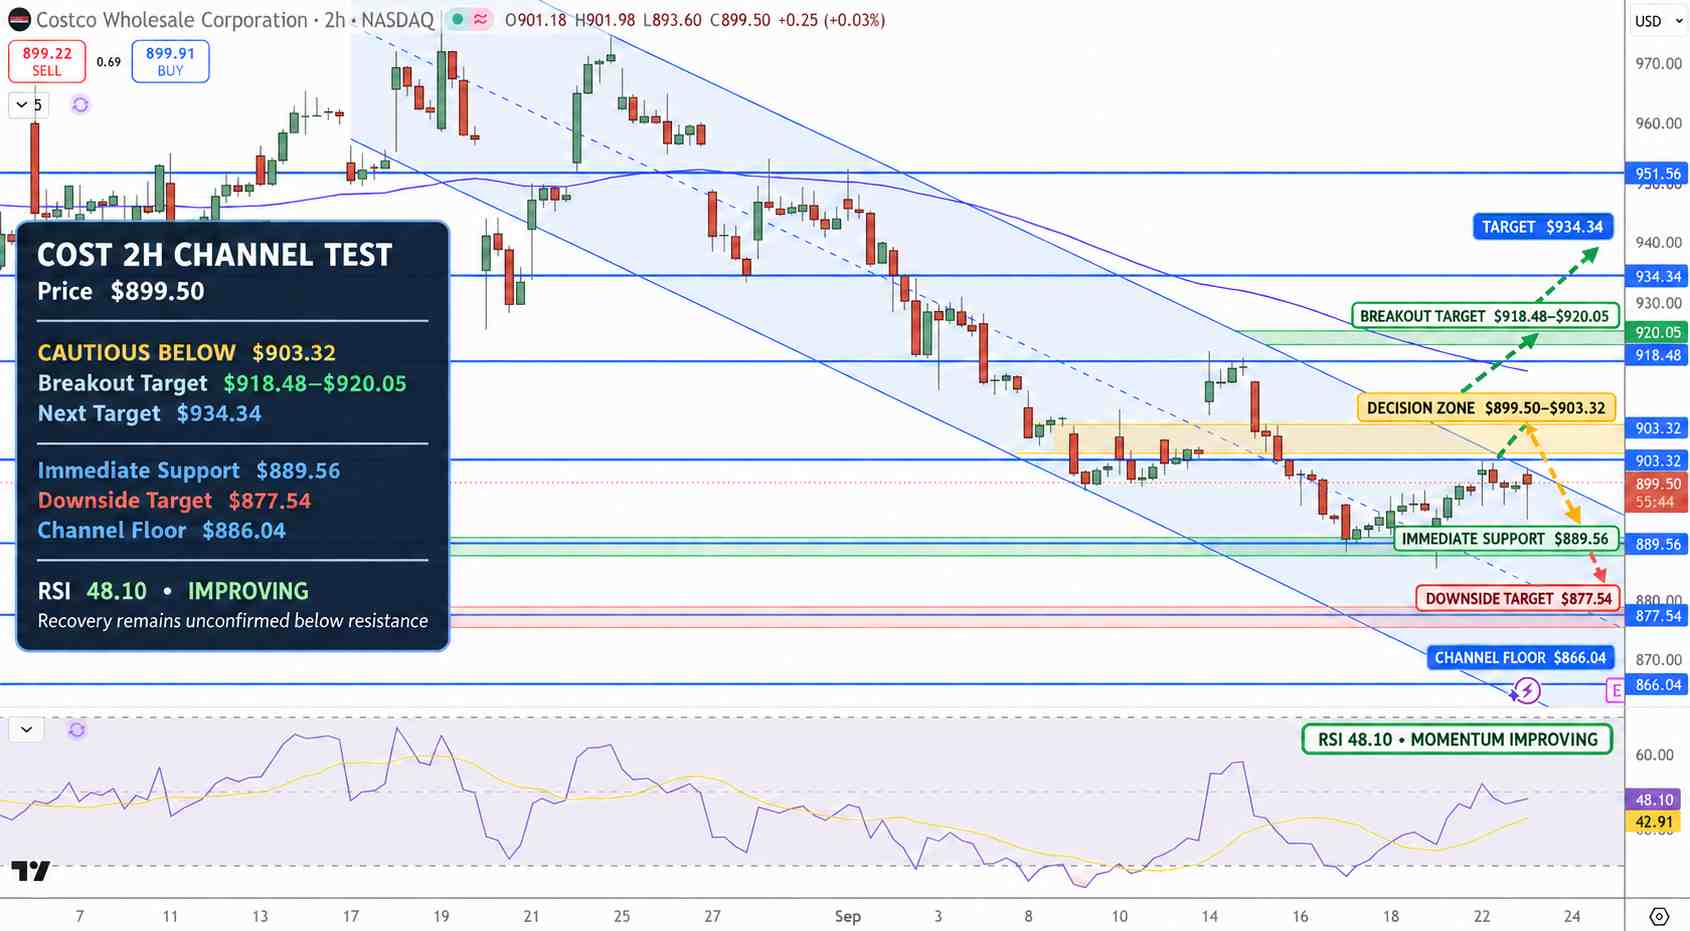
Costco Stock Price Chart - Source: Tradingview
The RSI is around 48, a little above its signal line, which is at 43, and is approaching the neutral region. While the selling pressure has ebbed, a confirmed bullish reversal is lacking.
Current resistance is the descending-channel ceiling near $903.32. A break above the channel and $903.32 would be bullish and have the next resistance near $918.48 to $920.05, followed by $934.34.
First support is at $889.56. A break below this supports the descending channel and extends down to the next support near $877.54.
I am cautious below $903.32, and am bearing in mind Thursday’s earnings. I am open to the possibility that bears will take a back seat before Thursday’s earnings.
Key Levels
• Latest Close: $899.41
• Support: $889.56, $877.54, $866.04
• Resistance: $903.32, $918.48 - $920.05, $934.34
• RSI: 48
• Bullish Breakout: $903.32; first upside target: $918.48 - $920.05
Why is Costco stock in focus now?
Costco announced that its fourth quarter 2026 sales were $93.9 billion. The company will publish full results on Thursday. With sales already announced, investors may focus on other elements of the report. These may include membership fees, margins, and earnings.
What level confirms a stronger COST recovery?
The next major technical resistance zone is around 918.48-920.05. A continued close above $903.32 would indicate that this resistance zone may be tested. However, a move below $889.56 may lead to another test of the support level at $877.54.
Bottom Line
Costco's operating fundamentals remain strong, but the pre-earnings technical structure is still cautious below $903.32. The company will report full Q4 results on Thursday. A stronger-than-expected membership, margin and EPS result could support a breakout, while weaker execution could pressure the stock.
COST has the potential to continue rising. A break above $903.32 would confirm an improving short-term trend and put 918.48-920.05 in focus. There is support at $889.56. A break below $877.54 would be a further indication of a continued downtrend.
Recommended Articles








Comments (0)
Click the $ button, enter the symbol, and select to link a stock, ETF, or other ticker.