


AutoZone Stock Tests $2,834 Support as Tuesday Earnings Could Decide the Next Move



AI Podcast


AutoZone closed at $2,844.31 on September 17, testing immediate support at $2,834.19 amid a near-term bearish technical bias. Fiscal Q4 2026 earnings, scheduled for September 22, serve as the primary catalyst, with consensus anticipating EPS of $54.30 and revenue of $6.71 billion. Key monitoring metrics include commercial sales momentum, same-store sales stability, and underlying gross margins. While ongoing share repurchases support EPS, a break below $2,834.19 risks further downside toward $2,783.62, whereas reclaiming resistance at $2,901.26 would signal a potential recovery.
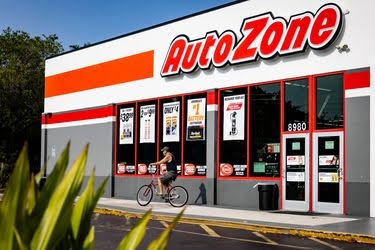
TradingKey - AutoZone closed at $2,844.31 on September 17, a decrease of 0.17%. This price is slightly above the $2,834 support. AutoZone has been declining since the September sell-off, but there should be more information after the company announces its quarterly report. The report should give more information about the expectations of the stock. The report is anticipated to show EPS of $54.30 and anticipated revenue of $6.71 billion. If the company does not show a beat of these anticipated numbers, positive information regarding same-store sales, commercial sales, and gross margins could allow the company to rebound from its 52-week lows.
Tuesday Earnings Are the Main Catalyst
Analyst consensus expects AutoZone to report earnings per share of $54.30 and overall revenue of $6.71 billion for fiscal Q4 2026. As a point of reference, in Q4 2025, AutoZone reported earnings per share of $48.71. Because the stock has already suffered a large decline, the bar has been set fairly low ahead of the report, and AutoZone could see an uptick in the stock price if the company reports domestic same-store sales and gross margin figures.
Commercial Sales Remain the Most Important Growth Engine
AutoZone continues to dominate the commercial, or “do for me” business. In Q3, domestic commercial sales increased by 10.4% to $1.4 billion. Commercial sales represented 33.8% of AutoZone’s domestic sales. Average weekly commercial program sales increased by 4.5% to approximately $18,500. I will be focused on this metric when the company reports Q4 results. Because AutoZone has opportunities to increase its commercial business through improvements such as more strategic distribution of its private brand Duralast, as well as further expansion of its Mega Hub network, I would expect commercial program sales to continue to outperform. If commercial sales continue to outperform in Q4, it suggests the company is less susceptible to slower demand in the do it yourself (DIY) business.
The 8,000th Store Highlights Long-Term Expansion
AutoZone opened its 8,000th store on September 10. The company, headquartered in Tennessee, has focused on expanding its presence in the U.S. and more recently in Mexico and Brazil. The number of stores is important because AutoZone’s model relies on Mega Hubs. A store transformation to a Mega Hub, which carries significantly more inventory, can improve parts distribution to commercial customers and neighboring stores. Management believes there is potential for 300 Mega Hubs. Beyond Mega Hubs, AutoZone can improve parts distribution and flexibility by focusing on same-store sales. Therefore, the company can use multiple levers to address the same fundamental business problem of improving parts availability and speed of delivery.
Same-Store Sales Need to Stabilize
In Q3 same-store sales increased 3.9% globally and 4.1% domestically, both on a constant currency basis. Management attributed the late third-quarter slowdown to weather. Management stated the last four weeks of the quarter experienced a slowdown in sales growth, with domestic comps at 2.9%, while the final two weeks were 1.3%. Like the prior quarter, management stated weather negatively impacted retail sales. Heat related items were negatively impacted by cooler than normal weather. Management expects Q4 average ticket growth in the mid-4% range and a normal increase in summer volume. A weak Q4 sales result could increase concerns that the late-Q3 slowdown reflected more than weather.
Gross Margin Quality Matters
During the quarter, AutoZone reported gross margin of 52.2% versus 52.7% last year. The current year decline was driven by a 77-basis-point unfavorable non-cash LIFO comparison, including a $20 million Q3 charge versus a $16 million credit last year. Excluding the LIFO comparison, gross margin increased by approximately 20 basis points. Management expects a solid Q4 underlying gross-margin performance, although faster commercial growth could create additional mix pressure.
Buybacks Continue Supporting EPS
AutoZone reduced its share count by reducing the number of shares outstanding by purchasing approximately $586 million of its own stock during Q3. The company has authorization from the board to repurchase an additional $1.5 billion of stock. Continued buybacks will support AutoZone’s earnings per share. I will be interested to see how many shares were repurchased during Q4 and the average share price bought during Q4. I am currently watching for any shares purchased by AutoZone at the current price of $2,844 because it may indicate that management views the shares as undervalued.
What Matters When Markets Reopen
The recent sell-off on the AutoZone stock has been severe. The current stock price implies little faith in the long term prospects of the company. Given the most recent share price near $2,800, an aggressive stock buyback program at these levels would signal management believes the stock is undervalued. I also expect management to report that gross margin has been stable after the adjustment for LIFO. If these expectations are not met, the recent decline in the stock may not fully be priced in.
AutoZone Technical Analysis: $2,834 Is the Immediate Breakdown Level
Currently trading at $2,844.31, AZO fell below previous support at $2,901.26. Each successive high has fallen beneath the resistance trendline. This occurred while prices remained far beneath the moving average near $2,951.50.
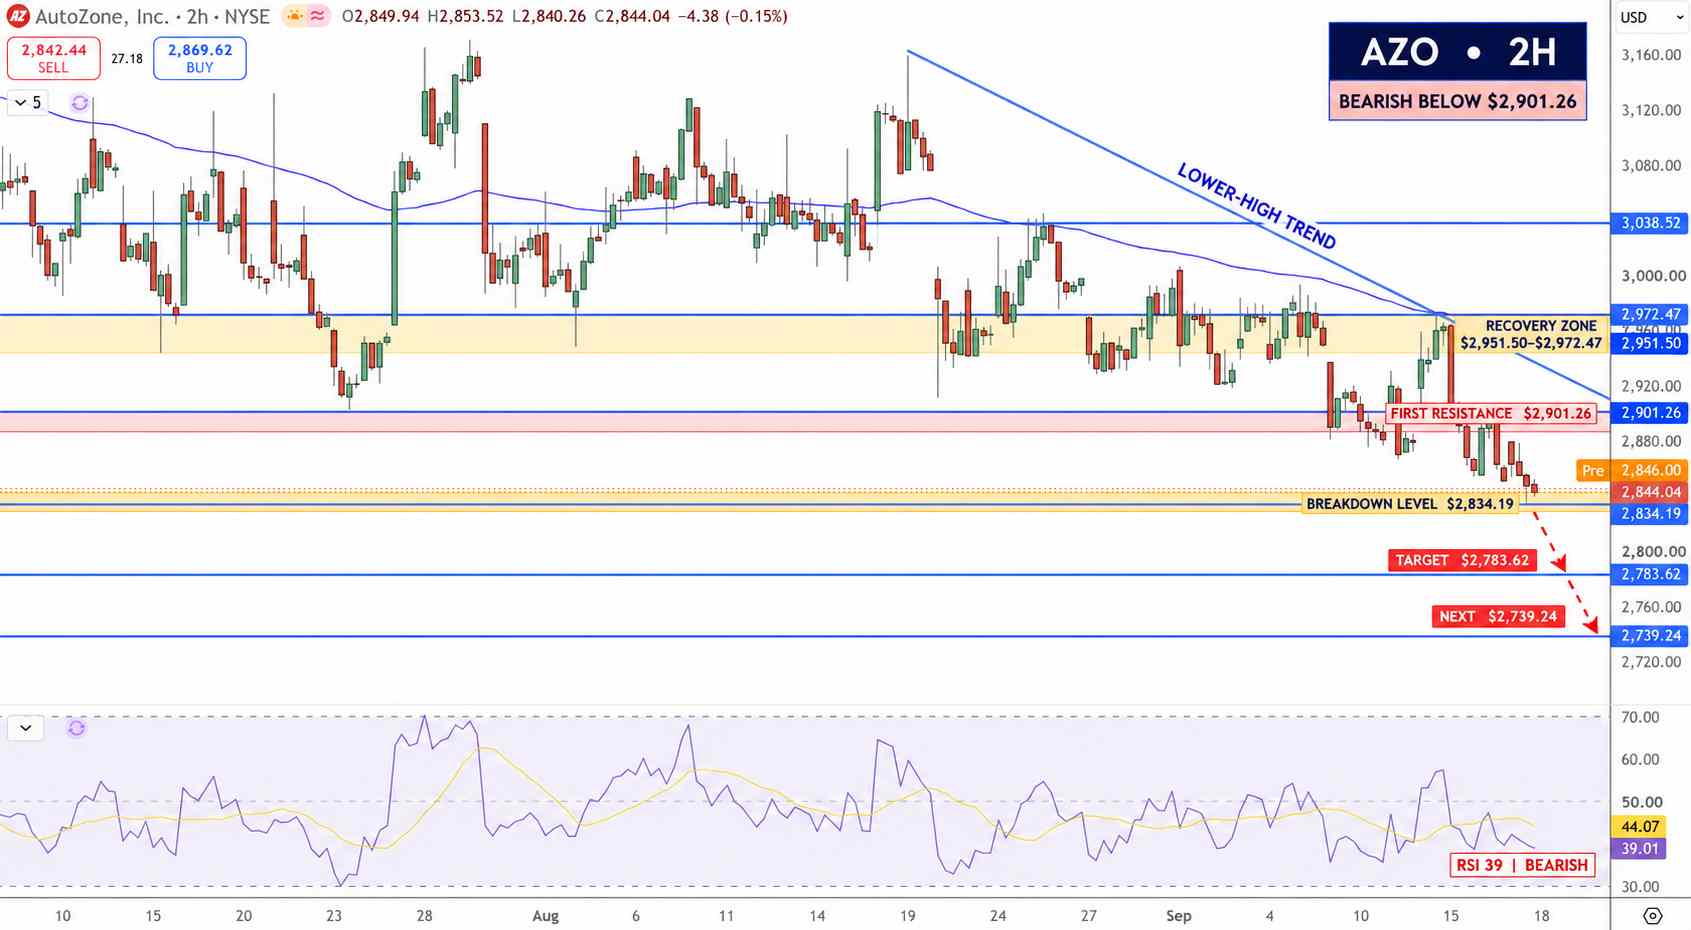
AutoZone Stock Price Chart - Source: Tradingview
Support lies at $2,834.19, which approximately matches the September 17th low of $2,834. A break of $2,834.19 would open $2,783.62 and $2,739.24 lower.
Neither the relative strength index (RSI) at 39, nor momentum, appear oversold. Therefore, further declines are expected.
For a potential upside move, resistance lies at $2,901.26, and, should it be broken, the falling trendline and the 2,951.50-2,972.47 resistance area could be tested.
Key Levels
• Closing price: $2,844.31
• Temporary support: $2,834.19
• Temporary resistance: $2,901.26
• Trendline resistance: $2,951.50
• Higher resistance: $2,972.47
• RSI: 39
Why is AutoZone stock in focus this weekend?
AutoZone will report 4th quarter earnings on September 22. Recently, same-store sales slowed late in Q3. However, commercial sales have remained strong and underlying gross margin improved after the LIFO comparison.
What level confirms a stronger AZO recovery?
Recouping $2,901.26 would be the first of possibly many recoveries. An upside breakout to 2,951.50-2,972.47 would be more constructive. A close below $2,834.19 would lower the focus to $2,783.62 and $2,739.24.
Bottom Line
Comparatively, the September chart of AutoZone looks much worse. Although a bullish bias is possible, in the short-term, a bearish bias is still valid. Although the stock has plenty of long-term bullish catalysts, the primary long-term concern is the quality of same-store sales and gross-margin. As previously mentioned, the upcoming earnings report is the main catalyst. I am biased to the downside and would cover my position at $2,901.26. I expect a break of $2,834.19 to be tested, and then lower to $2,783.62. A move above $2,901.26 would be a positive sign and possibly invalidate the near-term downtrend.
Recommended Articles









Comments (0)
Click the $ button, enter the symbol, and select to link a stock, ETF, or other ticker.