


Darden Stock Breaks $207.25 as Earnings Week Puts $202.75 Support in Focus



AI Podcast


Darden Restaurants trades near $206.74 ahead of its fiscal Q1 2027 earnings on September 24, 2026. Analysts expect $3.21 billion in revenue and $2.05 EPS. LongHorn Steakhouse remains a strong performer, whereas Olive Garden faces traffic and margin pressures from inflation and costs. FY2027 guidance projects EPS of $11.10–$11.35 and sales of $13.60–$13.75 billion. Technically, the stock displays a bearish near-term bias below the rising trendline, with immediate support at $202.73 and resistance at $207.25. Key risks include rising input costs, rate-sensitive consumer spending, and potential traffic slumps.

TradingKey - Darden Restaurants closed at $206.74 on the September 17th trading day. This is exactly in line with the $206.70 reported in the reference. Trading below the trendline and $207.25 hints at further declines before the Q1 report on 9/24. Q1 reports are important, but not as important as the consolidated reports. LongHorn Steakhouse has been a positive surprise in the last couple of quarters and helps to support the overall outlook and guidance given. With inflation hitting price points for all food suppliers, the main concern is how Olive Garden traffic numbers are looking since higher food, energy and financing costs are pressuring margins and consumer spending.
Q1 Earnings Are the Next Major Catalyst
Darden is scheduled to release fiscal Q1 2027 financials on September 24, 2026, before the stock market opens with its earnings call scheduled for 8:30am Eastern Time.
For fiscal Q1, the consensus among analysts is $3.21 billion in revenue, and EPS of $2.05.
More important than the headline EPS number is the quality of demand. There are other things to analyze regarding Darden, like Olive Garden guest counts, LongHorn same-restaurant sales, consolidated guest counts, and restaurant level margins.
LongHorn Remains the Strongest Brand
Darden's final quarter of fiscal 2026 was very strong. Overall sales for the final quarter were $3.72 billion, with a blended same-restaurant sales increase of 4.6 percent.
LongHorn Steakhouse led the company.
For the final quarter, LongHorn same restaurant sales were up 9.5 percent and full-year comparable sales were up 7.2 percent. For the final quarter, LongHorn sales were approximately $1.02 billion and segment profits were approximately $215.2 million, up from $167.8 million the prior year.
Of the numbers to watch this coming week, LongHorn is one of them.
LongHorn is successful, but holding longer term is risky because rising costs will eat into profits. Increasing demand and positive guest traffic is a good sign, but at what price is LongHorn taking this risk of rising input costs.
Olive Garden Needs Better Momentum
As Darden's largest revenue contributor (approximately $1.54 billion in quarterly revenue), the company should be expected to see growth close to its competitors. However, its same-restaurant sales grew only 2.4%, significantly slower than competitor LongHorn's 9.5% growth. For the year, Olive Garden same-restaurant sales grew by 4%.
With the September 24th report expected to show roughly 5.5% year-over-year consolidated revenue growth, there are concerns that Olive Garden will continue its sales slump. However, if there is a return to mid-single-digit sales growth, the report would be positively revaluated.
Typically, Darden has avoided heavy discounting, focusing more on value and consistency. If sales continue to increase without heavy promotional offers, this would likely signal positive overall trends.
Restaurant Spending Is Still Resilient
As of September 16, The Fed increased rates by 25 basis points, and as we know, there are still ongoing issues related to the price of energy due to the conflict in the Middle East. All of these factors, sooner or later, are likely to impact your customers and decrease your restaurants’ visitations.
FY2027 Guidance Provides a Clear Benchmark
Darden has provided some initial guidance for FY2027 (ending May 30, 2027), which includes expected consolidated sales in the range of $13.60-13.75 billion, and comp sales growth in the range of 2.5%-3.5%.
In addition, the Company expects the opening of around 75-80 new restaurants, approx. $875 million of Capex, ~3% inflation and EPS in the range of $11.10-11.35.
This guidance is fairly reasonable as it does not require the company to achieve another exceptional year like 2021.
It is also unlikely that DRI needs a stellar 1st quarter in order to trade higher. However, achieving similar goals for the year and maintaining other metrics within management's control should give the traders the confidence to trade DRI higher.
Inflation Is the Main Margin Risk
Darden is projecting a 3% inflation rate for FY2027. Higher costs for food, labor, energy and other items impacting transportation, for example, can quickly squeeze restaurant margins. Management may be challenged to pass higher costs along to customers through menu price increases in an effort to maintain customer traffic.
LongHorn and Olive Garden may be successful in balancing menu item prices and promotions to address some level of inflation; however, what happens if traffic and sales slow and management is forced to absorb increased costs?
Capital Returns Remain Supportive
On June 25, 2026, Darden announced an 8% increase for the quarterly dividend to $1.62.
The author suggests the dividend increase may forecast continued positive company performance and may partially explain the forward P/E ratio for Darden which is 18-19.
Darden may be valued somewhat fairly based on positive expectations for company performance. A decrease in company traffic may cause a significant decrease in the stock price.
Darden Restaurants Technical Analysis: $202.73 Is the Immediate Downside Test
The stock may trade lower from the current price of $206.74. Price has closed below the rising trend line. Traffic may be headed lower and price may not recover to previous highs.
RSI is just above 37. This reading is still bearish, but is considerably less so than earlier in the week. Additionally, the index has moved closer to oversold conditions, and as such, a minor bounce could be possible.
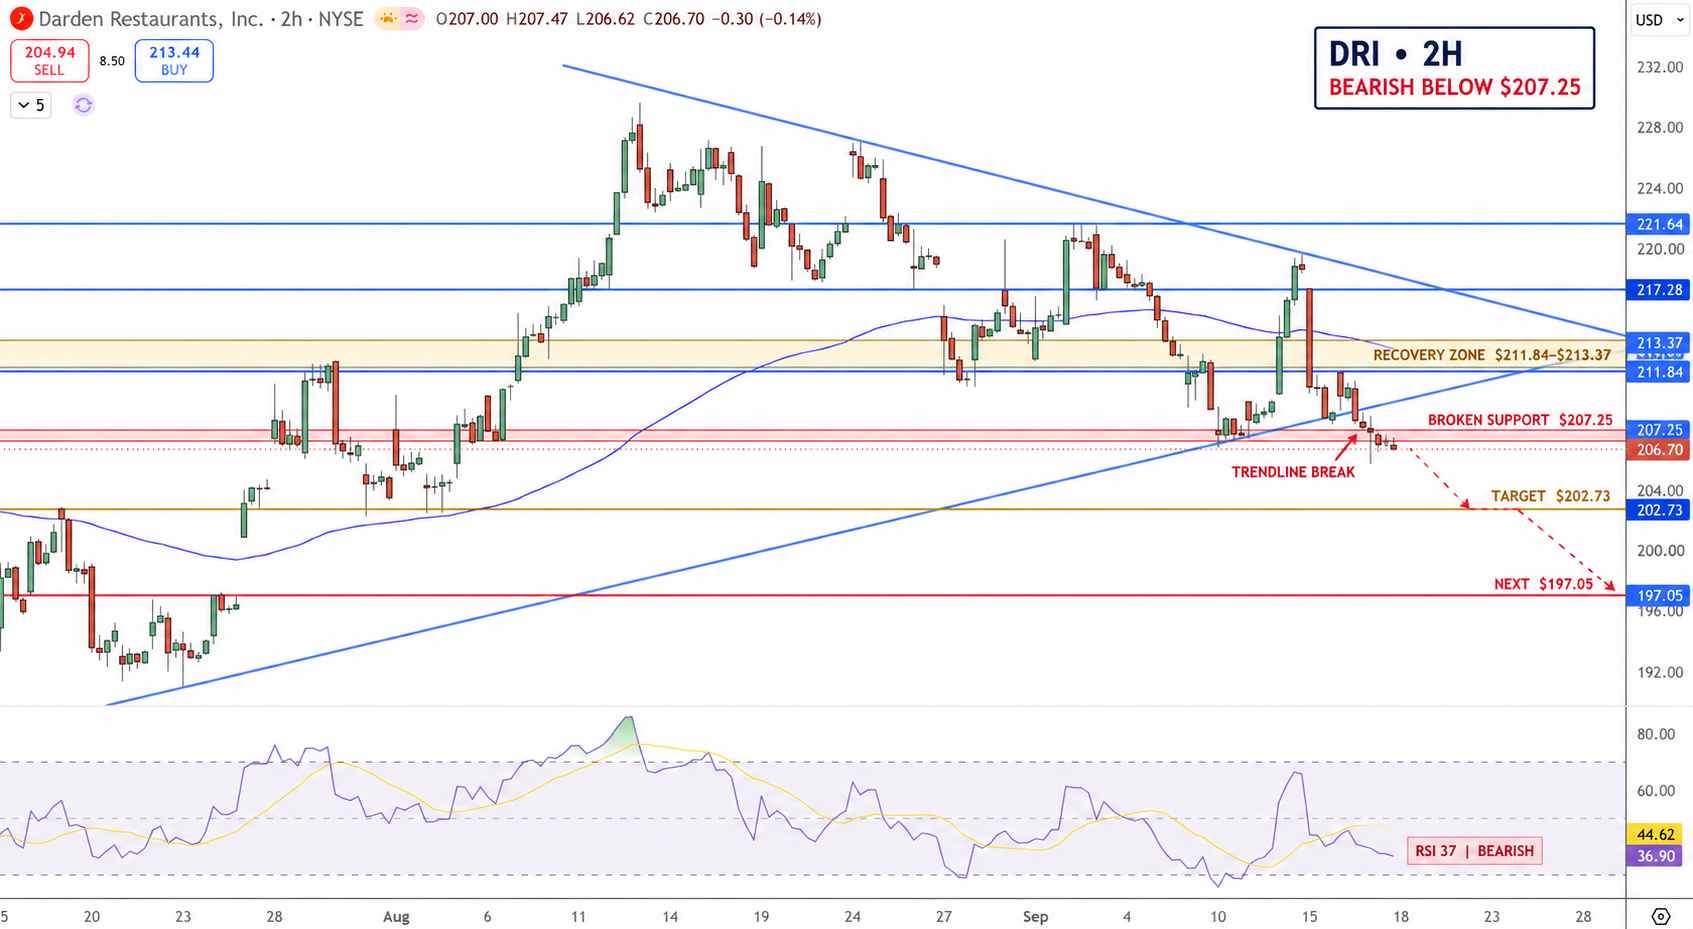
Darden Restaurants Price Chart - Source: Tradingview
The next key downside target is projected to be at $202.73, with a break of that level opening new lower targets at $197.05.
For the time being, the first resistance is projected to be found at $207.25. Should this level be reclaimed, the next resistance is projected to be found at $211.84. Beyond this level, the moving average is projected to provide additional resistance at $213.37.
Finally, the $217.28 level is projected to provide significant resistance.
Taking a more bearish view, $202.73 is projected to provide first support, with additional support expected at $197.05.
Why is Darden stock in focus now?
Darden will announce earnings on Sept. 24. While Olive Garden and LongHorn results will be closely monitored, investors will also focus on restaurant and company margins. The key question is whether Darden will reaffirm its FY2027 EPS guide of $11.10 to $11.35.
What level confirms a stronger DRI recovery?
A move above the $207.25 resistance level would be the first step in a better recovery. Improving the short-term trend would require moving above the $211.84 to $213.37 area. A failure to hold above $202.73 would suggest lower prices, possibly to the $197.05 area.
Bottom Line
From a fundamental view, the 9/18/26 Darden long call was an improvement. Positive long-term growth at LongHorn continues. Spending at restaurants continues and the guide provides a positive sign. Some risks are still Olive Garden traffic, further inflation, and the more rate-sensitive consumer. From a technical view, long Darden calls 9/18/26 remain at risk with a more Bearish outlook, especially below the 200-day moving average, with an emphasis on the 202.73 area. A move above the 211.84 to 213.37 area would be positive before earnings. A break below $202.73 would indicate the bulls are not yet in control.
Recommended Articles








Comments (0)
Click the $ button, enter the symbol, and select to link a stock, ETF, or other ticker.