


S&P 500 Index Forecast: Can US Stocks Still Rise After the Fed Resumes Rate Hikes?



AI Podcast


On September 16 ET, the Federal Reserve resumed rate hikes, raising the federal funds rate by 25 basis points to 3.75%–4.00% amid persistent inflation and economic resilience. The dot plot signaled higher-for-longer rates, pushing Treasury yields up and strengthening the dollar. U.S. equities declined, with the S&P 500 breaking below the 7,570 support level and the 60-day moving average. Technical indicators point to potential short-term downside targets at 7,400 and 7,300. Sustained high yields and valuation pressures pose ongoing risks for equities, though robust economic fundamentals and corporate earnings may provide downside support.

TradingKey - On September 16 ET, the Federal Reserve resumed rate hikes, raising the target range for the federal funds rate by 25 basis points to 3.75%–4.00%, marking its first rate increase since 2023. The rate hike was primarily driven by factors such as persistent inflation above target, rising energy prices, and the ongoing resilience of the U.S. economy. Meanwhile, the latest economic projections showed that the Fed raised its 2026 PCE inflation forecast to 3.7% and its core PCE forecast to 3.4%.
Following the interest rate decision, U.S. stocks turned from gains to losses. The S&P 500 Index closed down 0.45% at 7,551.81 points, the Dow fell 1.21%, while the Nasdaq was broadly flat. Meanwhile, the 2-year U.S. Treasury yield rose to around 4.74%, the 10-year yield moved back above 5%, and the U.S. dollar strengthened back above 100, reflecting that the market has begun to reprice a higher-for-longer interest rate environment.
Notably, the Fed's latest dot plot showed that the median federal funds rate forecast for the end of 2026 rose to 4.1%, higher than the 3.8% projected in June, indicating that a majority of officials expect room for further rate hikes within the year. The median rate forecast for the end of 2027 was also 4.1%, suggesting that policy rates may remain elevated for longer. Meanwhile, the Fed raised its 2026 GDP growth forecast from 2.2% to 2.3% and lowered its unemployment rate forecast from 4.3% to 4.1%, showing no clear signs of recession in economic fundamentals for now.
Therefore, the key conflict for the S&P 500 going forward remains the tug-of-war between corporate earnings growth and valuation pressure from high interest rates. If inflation remains persistently high and U.S. Treasury yields stay around 5%, U.S. stocks—especially high-valuation tech stocks—may continue to face pressure. However, if economic growth holds up and corporate earnings continue to improve, the index may still find fundamental support on the downside.
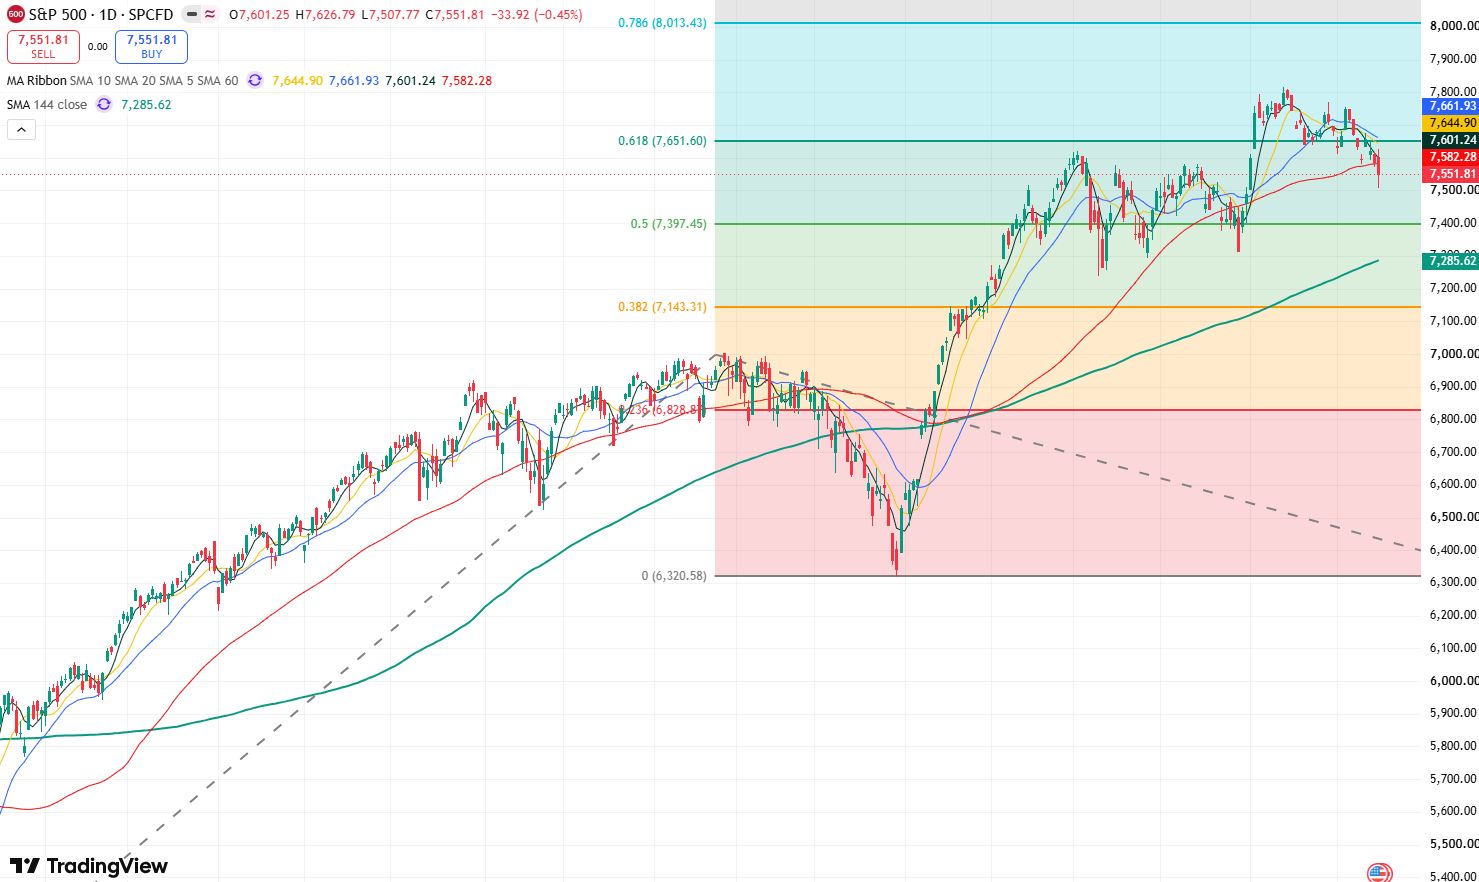
S&P 500 Daily Chart, Source: TradingView
Looking at the daily chart trend of the S&P 500 Index, the S&P 500 has broken below the 7,570 support level as well as the 60-day moving average, signaling a significant surge in bearish momentum that could extend the decline in the short term.
On the downside, as the S&P 500 broke below 7,570, further downside room has opened up. The primary downside target will be testing the 7,400 mark. If this level fails to hold, the S&P 500 will further test support at 7,300 and the 144-day moving average. If the 144-day moving average is breached, the S&P 500 will enter a prolonged period of consolidation, potentially falling back toward the 7,000 mark.
On the upside, the primary resistance level above for the S&P 500 to watch is 7,600, followed by 7,650. If it can hold firmly above 7,650, the S&P 500 still has the potential to challenge the 7,800 mark.
This content was translated using AI and reviewed for clarity. It is for informational purposes only.
Recommended Articles











Comments (0)
Click the $ button, enter the symbol, and select to link a stock, ETF, or other ticker.