


Bitcoin Price Prediction: As CLARITY Act Stalls and Fed Decision Looms, Will Bitcoin Price Continue to Fall?



AI Podcast


As of European trading on September 16, Bitcoin consolidates near $75,800 following a 3.25% drop driven by stalled US crypto regulation and Fed rate hike caution. The Senate’s failure to advance the CLARITY Act dampened risk appetite and delayed regulatory clarity. Investors await the upcoming Federal Reserve decision, with an expected 25-basis-point hike largely priced in, though future rate guidance remains critical. Technically, Bitcoin faces strong resistance below the 144-period SMA and daily moving averages, indicating potential downside risks toward support levels at $71,000, $70,000, and $67,000, with key upside resistance at $76,500.

TradingKey - As of the European trading session on September 16, Bitcoin (BTC) was consolidating near $75,800 following a sharp 3.25% drop on Tuesday, reflecting market caution ahead of the Federal Reserve's decision.
Crypto Bill Stalls as Fed Rate Hike Expectations Further Dampen Risk Appetite
From a fundamental perspective, the primary reason for Bitcoin's decline lies in the stalled progress of US cryptocurrency regulatory policy.
On Tuesday Eastern Time, the US Senate failed to advance the Digital Asset Market Clarity Act (CLARITY Act) as the procedural vote fell short of the 60-vote threshold required to move the bill forward, dealing another setback to plans to establish a unified regulatory framework for the US digital asset market. The bill was intended to further clarify the regulatory jurisdictions of the SEC and the CFTC over various digital assets and trading platforms, and was viewed by the crypto industry as key legislation to reduce US regulatory uncertainty.
Following the bill's failure to advance, the crypto market weakened rapidly. Bitcoin fell below $76,000, while crypto-related stocks such as Coinbase and Circle also experienced notable declines. For Bitcoin, the stalled legislation does not alter its network operations or supply mechanism, but it means market expectations for further clarity in the US crypto regulatory environment will have to be delayed. Especially after Bitcoin's sharp rebound in August, some policy tailwinds had already been priced in, so short-term profit-taking pressure increased after the bill failed to pass the procedural vote.
For investors, the key focus will be the upcoming September Federal Reserve interest rate decision, with the market currently widely expecting a 25-basis-point rate hike. According to a Reuters survey, about 85% of economists polled expect the Fed to raise the target range for the federal funds rate from 3.50%-3.75% to 3.75%-4.00%, with the market-priced probability of a rate hike soaring to 92.5%.
For Bitcoin, a 25-basis-point rate hike itself has been largely priced in, making the updated dot plot and statements by Fed Chair Kevin Warsh regarding the future rate hike path what truly matters. If the Fed hints that further rate hikes remain possible this year, US Treasury yields and the US dollar could stay elevated. Recently, the 10-year US Treasury yield has approached and briefly breached 5%; higher risk-free yields typically raise the opportunity cost of holding high-volatility assets like Bitcoin and weigh on market risk appetite.
Conversely, if the Fed hikes rates by 25 basis points but the dot plot does not significantly raise the future rate trajectory, or if Warsh emphasizes that future policy will remain data-dependent, the market's accumulated hawkish expectations could cool somewhat. This would leave room for the US dollar and Treasury yields to pull back, potentially providing Bitcoin with momentum for a short-term rebound.
Bitcoin Price Technical Analysis
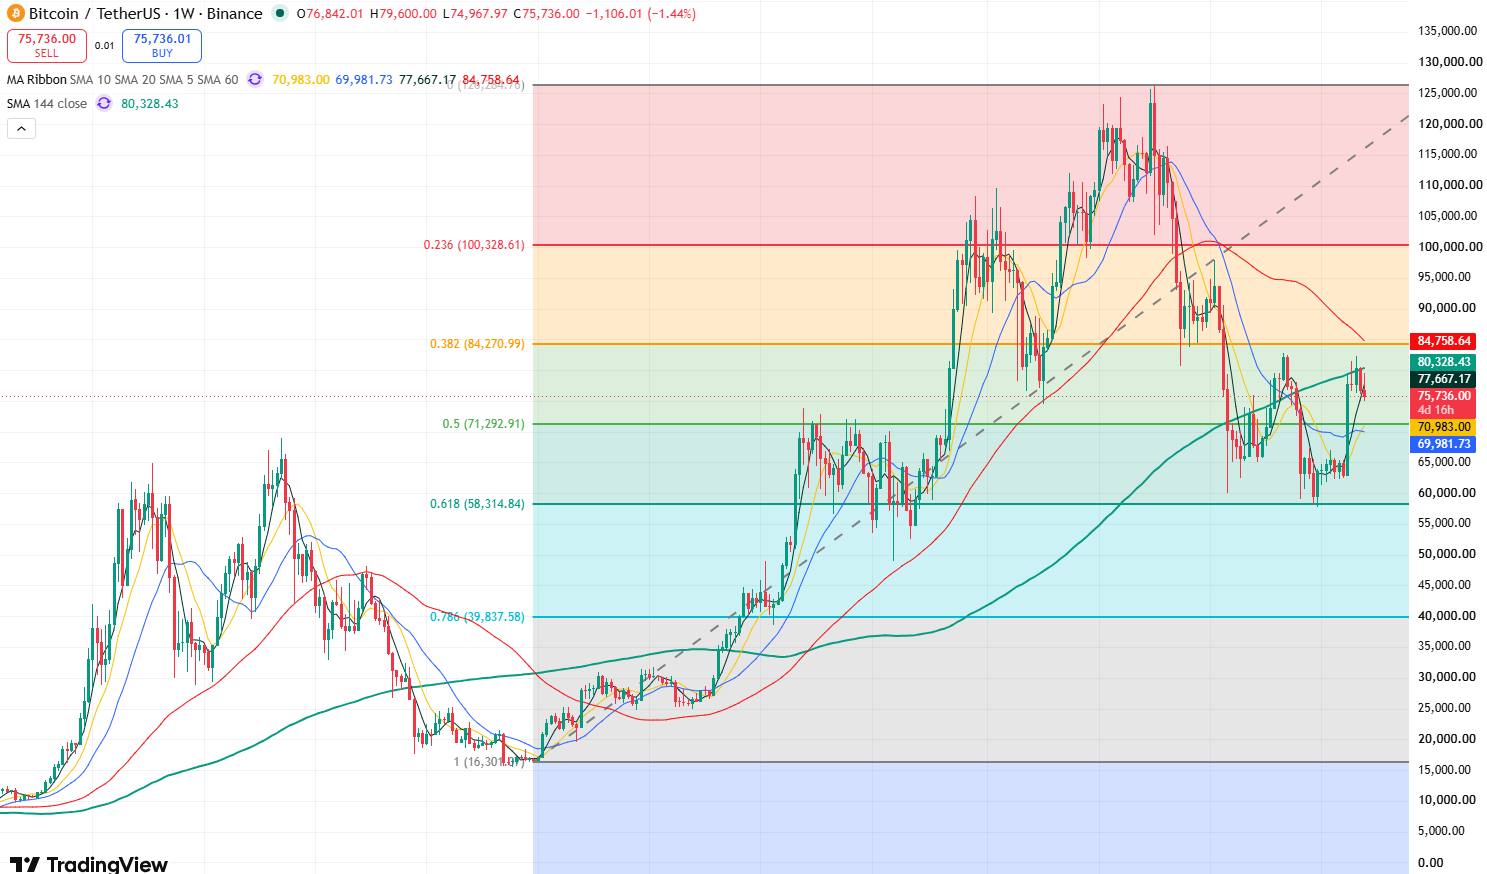
Bitcoin Price Weekly Chart, Source: TradingView
Looking at Bitcoin's weekly chart, Bitcoin staged a strong rebound above $82,000 in August, but it remains under pressure below the 144-period simple moving average (SMA144), indicating strong resistance from this line. Meanwhile, as Bitcoin's price continues to weaken below this moving average, bullish momentum in the market has been sapped, and the candlestick structure has weakened noticeably. Bitcoin may continue its overall downward trend and decline further.
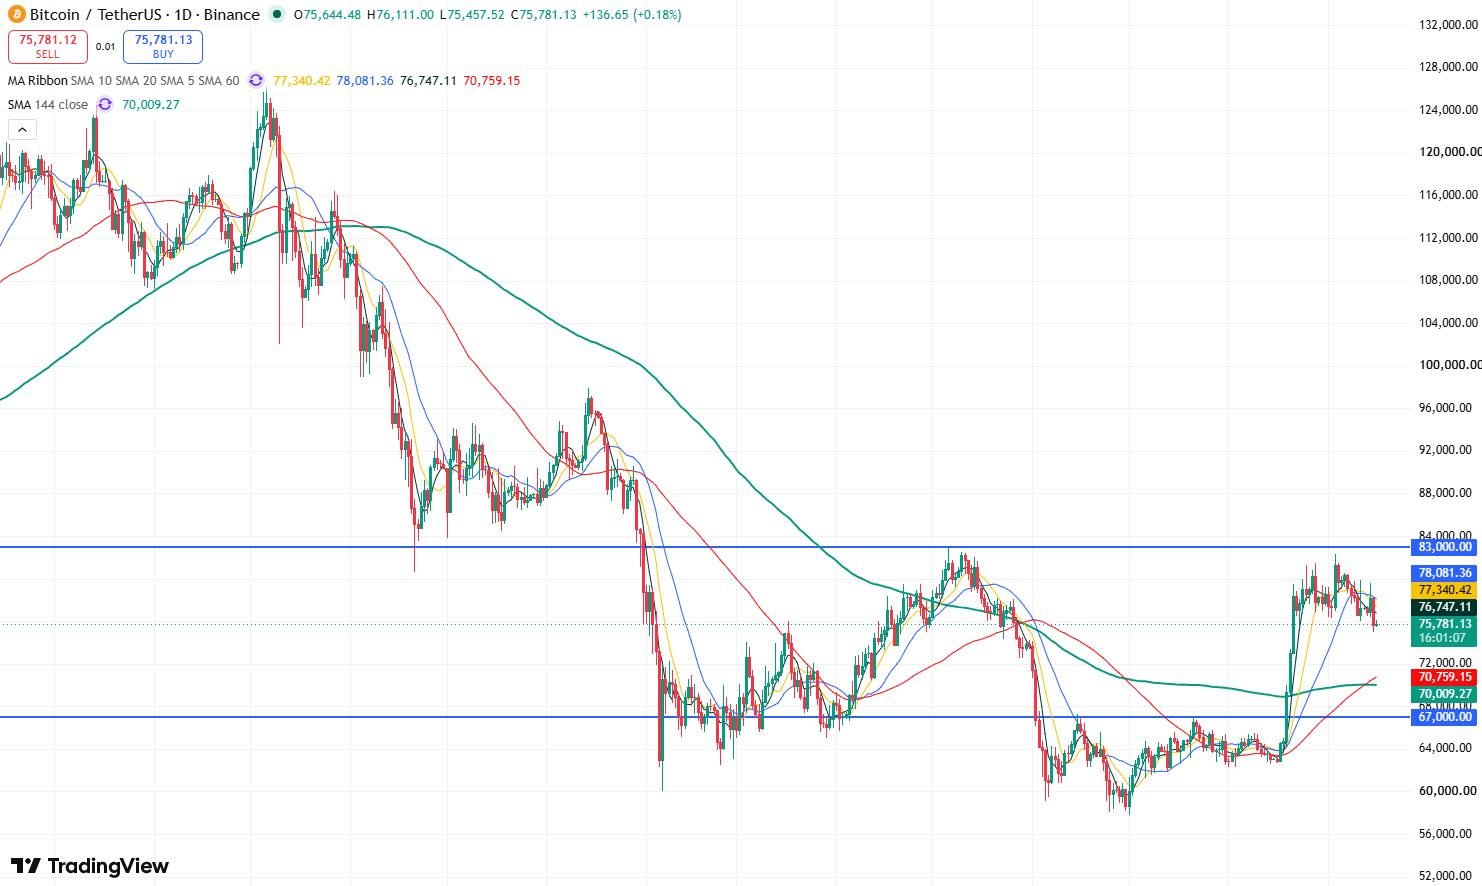
Bitcoin Price Daily Chart, Source: TradingView
Looking at Bitcoin's daily chart, although Bitcoin's recent strong rebound briefly surpassed $82,000, it failed to break above the rebound high of $82,850 formed in May, indicating that the candlestick pattern has not reversed the previous downtrend. Meanwhile, as Bitcoin fell below the short-term support level of $76,000, it may open up room for a deeper decline.
Currently, Bitcoin may test $71,000 on the downside in the short term. If it breaks below this level, it may test the $70,000 mark on the downside. If this level fails to hold, Bitcoin could fall back toward the support level of $67,000.
On the upside, the primary resistance level to watch above for Bitcoin is $76,500. If it can break through strongly and hold above this level, Bitcoin may test the $80,000 mark on the upside, and may even continue to challenge the resistance level of $83,000.
This content was translated using AI and reviewed for clarity. It is for informational purposes only.
Recommended Articles












Comments (0)
Click the $ button, enter the symbol, and select to link a stock, ETF, or other ticker.