


Bloom Energy Stock Price Forecast: Officially Joining S&P 500 on Sept. 21, Can Shares Break the Record High of $351?



AI Podcast


Bloom Energy reclaimed the $280 mark following its scheduled inclusion in the S&P 500 Index, effective before the market opens on September 21, driven by improved profitability and cash flow. Passive capital inflows and heavy investments from former U.S. House Speaker Nancy Pelosi’s family in July provided dual support for market sentiment and liquidity. Technically, the stock is testing the key $271.16–$303.76 resistance zone. A sustained breakout above the 0.786 Fibonacci level could target previous highs, while failure risks consolidation toward lower support levels.

TradingKey — On September 8, Eastern Time, Bloom Energy (BE) reclaimed the $280 mark after two months.
S&P Dow Jones Indices announced last Friday that Bloom Energy will be officially added to the S&P 500 Index, effective before the market opens on September 21. Back in July this year, the family portfolio of former U.S. House Speaker Nancy Pelosi had already placed a heavy bet on the stock. An index seat and a high-profile addition have provided Bloom Energy's stock price with dual support from both structural capital inflows and market sentiment.
The S&P 500 is not a simple automated list based on "the top 500 by market capitalization." Beyond criteria such as market cap, liquidity, and U.S. listing status, the S&P Index Committee also examines company profitability and retains a degree of subjective discretion.
In the past, Bloom Energy's biggest shortboard was precisely its profitability: as a fuel cell company long in an investment phase, its income statement performance had been a drag on its eligibility. The shift occurred in recent quarters—with rapid revenue growth and significant improvements in profits and cash flow, the company finally satisfied both criteria of "large market capitalization + profitability."
Inclusion in the S&P 500 means more than just a title. Index funds and ETFs tracking the S&P 500 will need to allocate funds to Bloom Energy according to index rules, creating a new wave of passive investment demand in the market. Regardless of whether active investors agree with its valuation, passive capital will be deployed according to index weight—a structural positive for improving the stock's liquidity and institutional ownership structure.
Beyond index inclusion, the celebrity effect provided another layer of news-driven support for Bloom Energy. The latest financial disclosure documents submitted by former U.S. House Speaker Nancy Pelosi show that her family significantly increased holdings in Bloom Energy stock and options in July.
Transaction Date | Underlying Asset | Quantity | Disclosed Value Range |
July 24 | Class A Common Stock | 10,000 shares | $1 million to $5 million |
July 24 | Call Options (Strike price $100, expiring June 17, 2027) | 100 contracts | $1 million to $5 million |
July 28 | Common Stock | 5,000 shares | $500,000 to $1 million |
July 28 | Call Options (Strike price $100, expiring June 17, 2027) | 100 contracts | $500,000 to $1 million |
Filings show that the first transaction occurred on July 24: buying 10,000 shares of Class A common stock with a disclosed value range of $1 million to $5 million; during the same period, purchasing 100 call option contracts with a strike price of $100 and an expiration date of June 17, 2027, with the disclosed value also between $1 million and $5 million. On July 28, the Pelosi family bought another 5,000 shares of common stock, with a disclosed value range of $500,000 to $1 million; simultaneously adding 100 call option contracts with the same strike price and expiration date, also with a disclosed value range of $500,000 to $1 million.
In aggregate across both transactions, the Bloom Energy assets held by the Pelosi family include 15,000 shares of common stock and 200 call option contracts, totaling between $3 million and $12 million based on the disclosed value ranges.
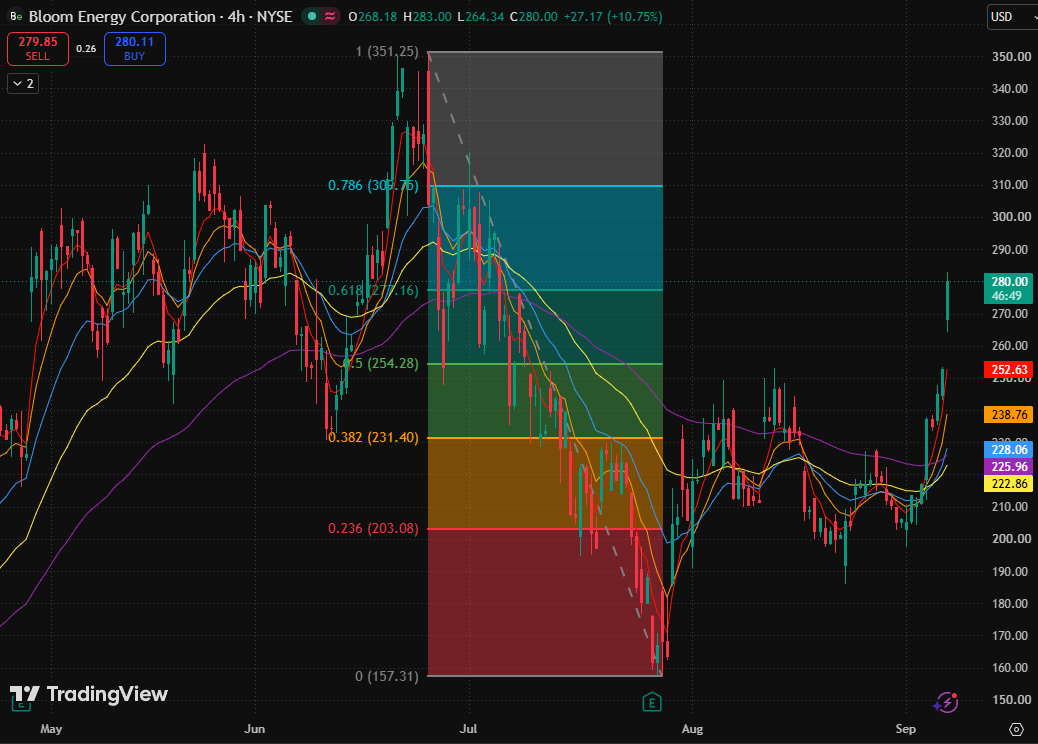
Bloom Energy 4-hour stock price chart, Source: TradingView
Bloom Energy's stock price previously pulled back sharply after peaking near its early-July high ($351.25), dropping to a local low near $157.31 in late July before entering a period of rebound and recovery.
Currently, the stock price has strongly crossed above the 0.618 Fibonacci retracement level ($271.16) and is trading above multiple moving averages, with short-term moving averages showing a bullish alignment. The short-term rebound structure remains intact, but overhead price action is approaching the 0.786 Fibonacci retracement level ($303.76) resistance zone, entering a key battleground testing phase within the $271.16–$303.76 range.
On the upside, the first key resistance above is the 0.786 Fibonacci retracement level ($303.76). If the stock price can hold firm above this level going forward, room for further upside could open toward the previous high ($351.25).
If the stock price faces repeated resistance near the 0.786 Fibonacci retracement level ($303.76) and falls back below the 0.618 Fibonacci retracement level ($271.16), this round of rapid rally will shift into a high-level consolidation, with the focus of pullbacks shifting toward the support zone formed by the 0.5 Fibonacci retracement level ($254.28) and the 5-day moving average ($252.77).
This content was translated using AI and reviewed for clarity. It is for informational purposes only.
Recommended Articles











Comments (0)
Click the $ button, enter the symbol, and select to link a stock, ETF, or other ticker.