


SanDisk Stock Forecast: QLC Enterprise SSD Enters Volume Ramp Phase, Revenue Rises 103% QoQ, Stock Expected to Extend Rally



AI Podcast


SanDisk shares gained over 2% following MSCI USA Index inclusion and a breakout above short-term consolidation, supported by strong technical levels. Globally, Q2 2026 enterprise SSD revenue for top brands surged 103.6% quarter-on-quarter to $37.59 billion, driven by generative AI demand and cloud deployments. Micron led growth with a 126.3% revenue jump, while SanDisk’s enterprise SSD revenue rose 102.9% to $2.98 billion amid volume ramps for high-capacity QLC products. Industry revenue is projected to climb further in Q3, fueled by AI agent services and Nvidia GB-series shipments, though technical resistance at $1,632.16 poses near-term pullback risks.
TradingKey - On September 1 Eastern Time, SanDisk (SNDK) stock rose 5% yesterday after being added to the MSCI USA Index, before reversing earlier losses to gain over 2% today.
According to the latest memory industry research by TrendForce, combined revenue for the world's top five enterprise SSD brands in the second quarter of 2026 reached nearly $37.59 billion, representing a quarterly surge of 103.6%.
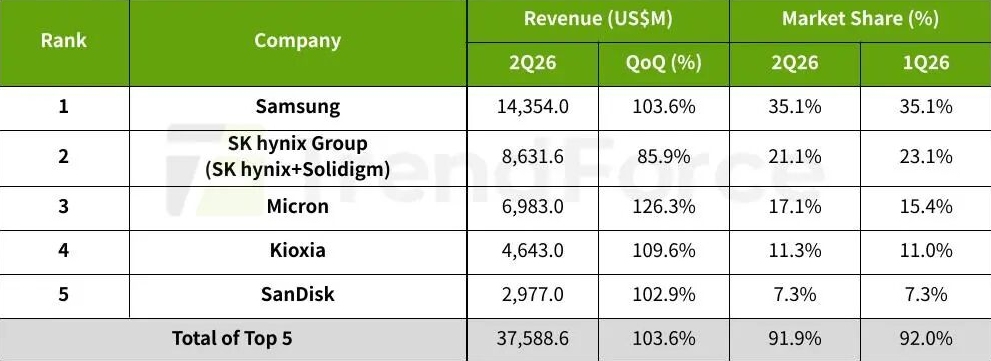
Source: TrendForce
The research firm expects that in the third quarter, the growing popularity of generative AI agent services, steady deployment of data center infrastructure by cloud service providers (CSPs), and mass shipments of Nvidia's (NVDA) GB-series AI server cabinets will help keep enterprise SSD demand elevated, driving industry revenue to new heights.
In the second quarter, Micron's (MU) enterprise SSD revenue surged by 126.3% quarter-on-quarter to approximately $6.98 billion, achieving the highest growth rate among the top five suppliers. Following the AI boom, Micron has concentrated its production capacity on enterprise SSDs and HBM.
During the period, as SanDisk's high-capacity QLC enterprise SSDs entered a volume ramp phase that boosted quarterly bit shipments, its overall enterprise SSD revenue grew 102.9% quarter-on-quarter to nearly $2.98 billion.
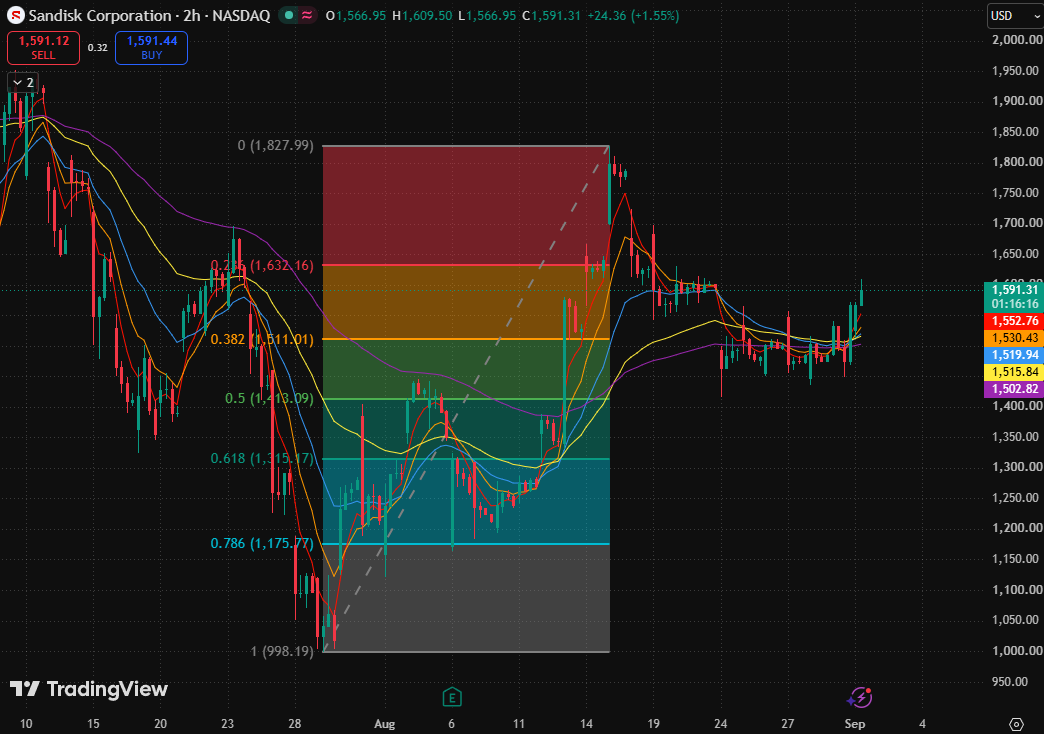
SanDisk stock price chart, Source: TradingView
SanDisk's stock price has recently consolidated repeatedly in the $1,480–$1,550 range, and today it briefly broke out above its short-term consolidation zone. The stock has now reclaimed short-, medium-, and long-term moving averages including the 5-day, 10-day, and 20-day moving averages, and trades above the 0.382 Fibonacci retracement level ($1,511.01), showing a stronger short-term structure.
On the upside, the primary resistance level is the 0.236 Fibonacci retracement level ($1,632.16). A sustained move above this level could extend the rebound toward the key psychological mark of $1,700 and the period high of $1,827.99.
If the stock faces resistance at $1,632.16 and falls back below $1,553.12, it is more likely to re-enter a consolidation range between $1,511.01 and $1,632.16. A further loss of the 10-day and 20-day moving averages would significantly weaken short-term bullish momentum.
This content was translated using AI and reviewed for clarity. It is for informational purposes only.
Recommended Articles










Comments (0)
Click the $ button, enter the symbol, and select to link a stock, ETF, or other ticker.