


HP Stock Price Prediction: Why Did It Still Plunge 9% After Q3 Earnings Beat?



AI Podcast


HP reported third-quarter revenue of $15.68 billion and adjusted EPS beating expectations, though results included a one-time tariff refund, and net profit declined year-over-year. Despite an 18% rise in Personal Systems revenue, total unit sales dropped 16%, with growth driven by price hikes and product mix rather than demand recovery. Rising memory costs, a 2% revenue decline in the Printing business, and concerns over margin sustainability triggered a post-earnings stock drop of up to 9.2%. Technically, the drop threatens key moving averages, with critical support watched near $28.13 to $28.17 and deeper support at the 60-day moving average.

TradingKey - HP (HPQ) delivered third-quarter revenue and earnings that beat expectations, but the upbeat figures failed to dispel investor concerns over PC sales, memory costs, and profit margins. Following the release, HP's stock dropped as much as 9.2% in after-hours trading to $27.70, erasing nearly all of its 3.39% gain during the regular session.
For the third quarter of fiscal 2026 ended July 31, HP's net revenue increased 12.5% year-over-year to $15.68 billion, topping market expectations of $14.44 billion; adjusted earnings per share came in at $0.83, also significantly exceeding analysts' forecasts.
However, earnings per share for the quarter included a $0.11 tariff refund. Excluding this one-time benefit, the profit improvement was less impressive than the headline figures suggest. HP's official financial report showed that net profit fell from $763 million in the prior-year period to $661 million, while diluted earnings per share dropped from $0.80 to $0.71.
PC Revenue Rose 18%, Why Did Sales Volume Fall 16%?
The Personal Systems segment remained the primary driver of HP's revenue growth, with the division's third-quarter revenue reaching $11.77 billion, up 18% year-over-year, as commercial PC revenue grew 22% and consumer PC revenue rose 10%.
However, revenue growth was not driven by shipment expansion. HP's total PC unit sales fell 16% year-over-year, with consumer product sales declining 19% and commercial product sales dropping 14%. This indicates that growth this quarter largely stemmed from price hikes and product mix upgrades, rather than a broad-based recovery in end demand.
HP Chief Financial Officer Karen Parkhill stated that the company offset the pressure from declining unit sales by prioritizing high-value products, adjusting prices in line with raw material costs, and expanding service revenue.
While this strategy temporarily defended revenue scale, continued price increases could suppress future demand, leading the market to question whether the current pace of growth can be sustained.
Rising Memory Costs Become Main Reason for HP's After-Hours Decline
Management expects memory and storage costs as a percentage of product bill of materials to rise further in the fourth quarter, potentially causing revenue to fall below normal seasonality and margins to retreat from the third quarter.
Although HP had previously taken measures such as raising prices, adjusting product mix, and improving supply, and noted that memory supply and order fulfillment rates had improved, improved supply does not equate to lower procurement costs.
Against the backdrop of AI servers and AI PCs jointly driving up demand for memory chips, continuously rising memory prices are squeezing profit margins in the Personal Systems business. The segment's third-quarter operating margin was only 4.6%, leaving it with insufficient cost buffer to begin with.
The Printing business also failed to fully offset pressure from the PC business, with the segment's third-quarter revenue falling 2% year over year to $3.91 billion, supplies revenue declining 3%, and hardware sales dropping 7%. Although the Printing business still maintained a relatively high operating margin of 18.1%, the ongoing revenue contraction means this traditional profit driver is providing diminishing support to HP's overall performance.
Declining PC sales, growth dependent on price increases, memory costs continuing to climb, combined with a lack of growth momentum in the Printing business, have kept investors cautious about profitability in the next phase. Considering that HP's stock price had gained about 18.5% over the preceding month, profit-taking by some capital after the earnings report also amplified its post-market drop.
HP Stock Price Technical Analysis
Source: TradingView
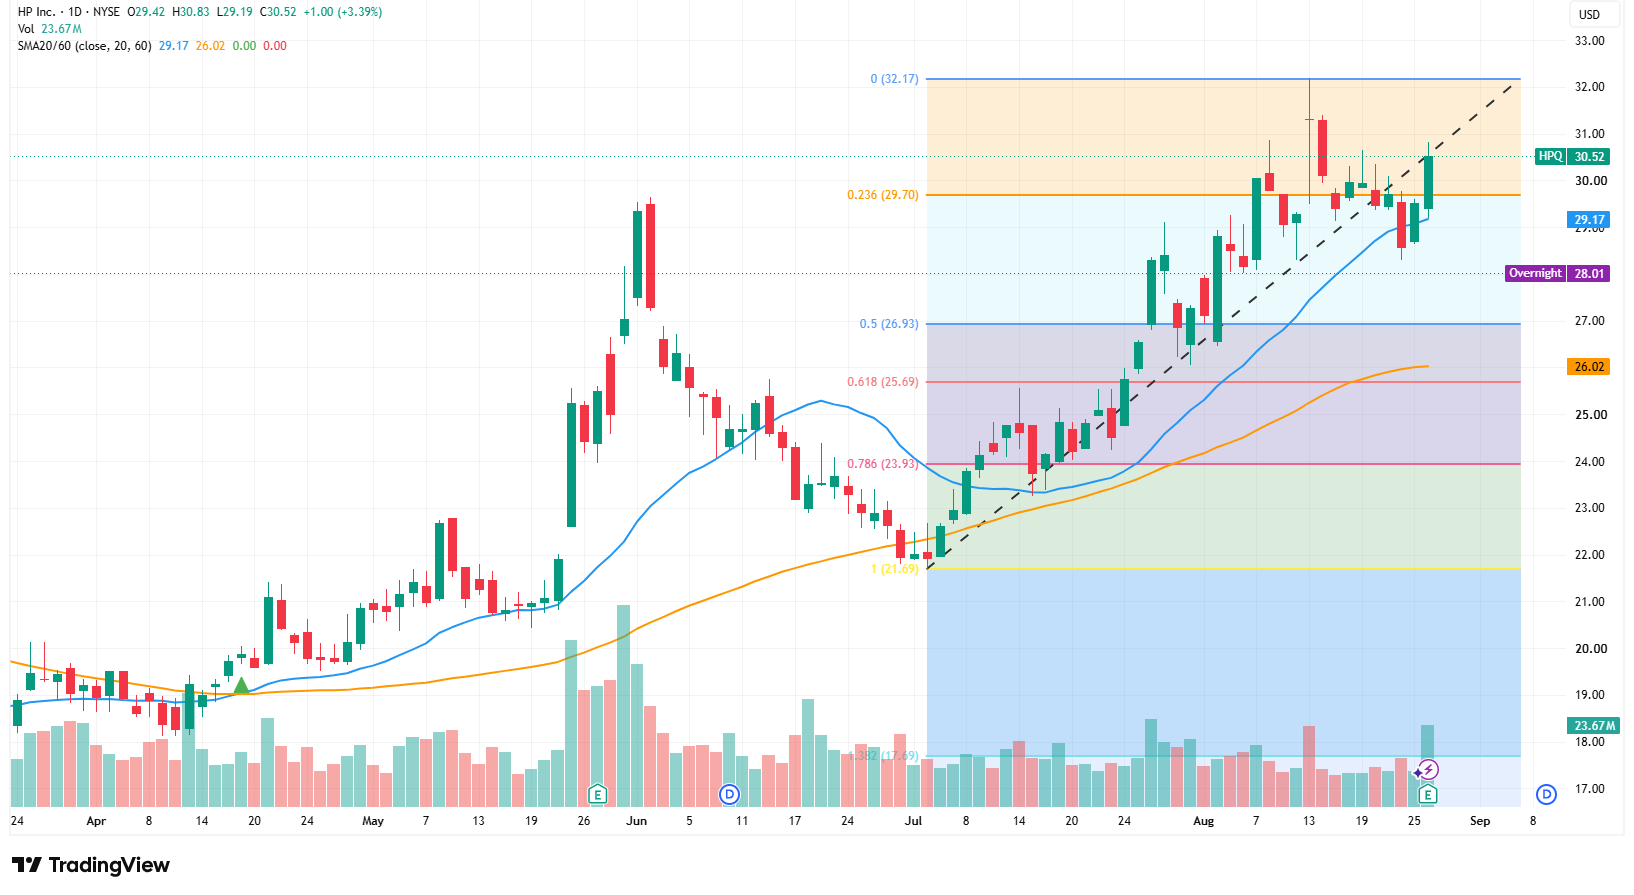
From a daily chart perspective, HPQ closed at $30.52 ahead of its earnings report, remaining above its 20-day moving average of $29.17 and 60-day moving average of $26.02. Furthermore, with the 20-day moving average positioned above the 60-day moving average, the medium-term uptrend structure remained intact ahead of the earnings release. However, the stock had previously encountered resistance multiple times in the $31 to $32.17 range, indicating clear selling pressure near previous highs.
Following the earnings report, HPQ dropped about 9% in after-hours trading, suggesting that the stock price could gap down below the 20-day moving average, the uptrend line, and the 0.236 Fibonacci retracement level at $29.70, shifting its short-term trend from strong to weak.
Currently, the most critical support lies between $28.13 and $28.17, corresponding to the 0.382 Fibonacci retracement level. If this zone holds during regular trading hours, the stock could experience a technical rebound, first testing the 20-day moving average at $29.17 and then watching $29.70. Only a high-volume recovery above $29.70 to $30.52 would indicate that post-earnings selling pressure is beginning to ease, paving the way for another attempt at the previous highs of $31 and $32.17.
If the daily chart closes below $28.17 on heavy volume, it would mean the short-term uptrend structure is further damaged, with the next support moving down to the 0.5 retracement level at $26.93. More crucial support is concentrated between $25.69 and $26.02, which encompasses the 0.618 retracement level and the 60-day moving average. If $26 is also breached, the medium-term uptrend will cool down significantly, and the stock price could fall further toward around $23.93.
This content was translated using AI and reviewed for clarity. It is for informational purposes only.
Recommended Articles









Comments (0)
Click the $ button, enter the symbol, and select to link a stock, ETF, or other ticker.