


Bloom Energy Stock Price Prediction: Will the Stock Recover After Former US House Speaker Pelosi Increases Stake?



AI Podcast


Former U.S. House Speaker Nancy Pelosi recently disclosed significant acquisitions of Bloom Energy stock and long-term call options, totaling between $3 million and $12 million. Despite this insider accumulation, Bloom Energy remains in a weak technical structure following a 38% correction from its June peak. Jefferies maintains a hold rating with a $246 price target, citing rich valuations and execution risks. While short-term moving averages show minor recovery attempts, medium-term resistance levels between $211 and $217 remain unbroken. Investors should exercise caution regarding potential false breakouts until a sustained recovery above key retracement levels is confirmed.

TradingKey - Former U.S. House Speaker Nancy Pelosi has filed new financial disclosure documents. The filing reveals that Pelosi significantly increased her holdings in Bloom Energy (BE) stock and options.
Bloom Energy's stock price has fluctuated downward since hitting an all-time high of $351.28 on June 25, with a cumulative decline of approximately 38% to date.
According to the filing, the first transaction involving Bloom Energy took place on July 24, involving 10,000 shares of Class A common stock with a disclosed value ranging from $1 million to $5 million. Meanwhile, 100 in-the-money call option contracts were purchased with a strike price of $100 and an expiration date of June 17, 2027. The disclosed value of these options also fell between $1 million and $5 million.
On July 28, Pelosi bought an additional 5,000 shares of Bloom Energy common stock, with a disclosed value between $500,000 and $1 million. Additionally, the family added 100 call option contracts with a strike price of $100 and an expiration date of June 17, 2027. The disclosed value of these options was also between $500,000 and $1 million.
Combining the two transactions, the Bloom Energy assets disclosed by Pelosi include 15,000 shares of common stock and 200 call option contracts. Calculated based on the value ranges in the financial disclosure documents, the total disclosed value of this Bloom Energy portfolio is between $3 million and $12 million.
Recently, Jefferies raised its price target on Bloom Energy from $207 to $246 while maintaining a "Hold" rating.
The firm stated that the AEP Wyoming project and its approval timeline remain key execution watchpoints. It noted that despite raising the price target, it maintained the "Hold" rating due to rich valuation.
The firm forecasts Bloom Energy's full-year 2026 gross margin to be approximately 34%, in line with company guidance, and expects further expansion by 2030. It noted that given the focus of the latest management incentive package, it is closely monitoring potential upside in the pace of gross margin expansion.
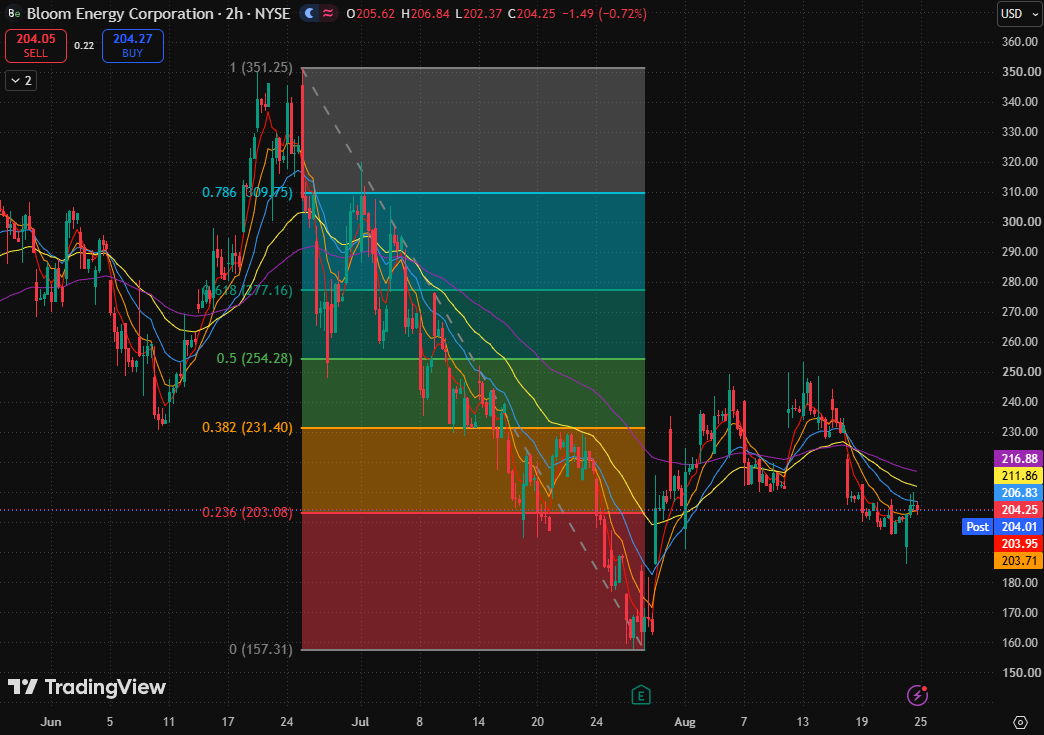
Bloom Energy two-hour stock chart, Source: TradingView
After peaking near $351.25, Bloom Energy's stock price formed a clear downward channel before pulling back sharply to around $157.31. A rebound from the lows temporarily pushed the price above $240, but it has recently retreated again, indicating that overhead selling pressure has not been fully absorbed. The current price action resembles a post-decline consolidation rather than a confirmed reversal.
Currently, the stock price remains above the 0.236 Fibonacci retracement level ($203.08), but below the 20-day moving average ($206.83), 80-day moving average ($211.86), and 160-day moving average ($216.88). Having only reclaimed the 5-day moving average ($203.95) and 10-day moving average ($203.71), the rebound has not altered the overall weak structure.
To the upside, if the price breaks above the 20-day moving average ($206.83) but fails to hold above the 80-day ($211.86) and 160-day ($216.88) moving averages, it can still only be defined as a short-term consolidation. Only a sustained hold above $216.88, followed by a further break above the 0.382 Fibonacci retracement level ($231.40), would shift the trend from a weak consolidation into a clearer recovery structure.
If this low support zone fails to hold, the downside could once again target the 0 Fibonacci retracement level near $157.31. Because the 160-day moving average ($216.88) remains above the current price and the previous rebound near $240 failed to sustain momentum, medium-term pressure has not been relieved, and investors should remain cautious of bull traps and false breakouts during any rebound.
This content was translated using AI and reviewed for clarity. It is for informational purposes only.
Recommended Articles












Comments (0)
Click the $ button, enter the symbol, and select to link a stock, ETF, or other ticker.