


Goldman Sachs Q2 2026: Record Revenue $20.34B, EPS Surge 92%, ROE 23.5% on Equities Boom



AI Podcast


Goldman Sachs reported a 39% year-on-year increase in second quarter 2026 revenues to $20.34 billion, driven by exceptional performance in Global Banking and Markets and record Asset & Wealth Management inflows reaching $4.04 trillion. Despite headwinds in Platform Solutions from Apple Card loan markdowns, robust capital generation prompted an 11% dividend increase to $5.00. The firm exhibits strong profitability and a five-year-high M&A backlog, though economic slowdowns and market volatility remain key risks. Technically, the stock is consolidating in a symmetrical triangle, with a breakout above $1,055 targeting $1,077 to $1,101.
TradingKey - Goldman Sachs (GS) reported a 39% year on year increase in second quarter 2026 revenues reaching $20.34 billion. This was boosted by strong results across different units and in particular, the Global Banking and Markets division which recorded revenues of $15.52 billion, an increase of 53% compared to the prior comparable quarter. The strong quarter was driven by exceptional performances recorded in both Advisory and Underwriting. During the second quarter of 2026, the Global Banking and Markets division recorded equities of $7.42 billion, an increase of 72% over the same quarter last year.
Strong performances were recorded in both Advisory (a 17% increase) and Underwriting (a 130% increase). These were driven by the robust secondary and IPO market activities. Investment Banking Fees increased by 55% to $3.4 billion. Asset & Wealth management recorded revenues of $4.6 billion, an increase of 20% driven by net long-term inflows of $91 billion to record assets under management of $4.04 trillion. The firm signaled confidence in its ability to sustain profitability when it announced an 11% increase in its quarterly dividend to $5.00.
Global Banking & Markets: Record $15.52B Revenue, Equities the Star
GBM net revenues $15.52B (+53% YoY). Equities $7.42B (+72% YoY, third straight quarter of industry-leading performance per Bloomberg). FICC $4.59B (+32% YoY). Investment banking fees $3.4B (+55% YoY). Advisory $1.38B (+17% YoY on 17% industry M&A volume growth). Equity underwriting $985M (+130% YoY on strong secondary and IPO activity).
Debt underwriting $1.0B (+75% YoY). M&A and strategic advisory activity described as accelerating; investment banking backlog hit five-year high.
Asset & Wealth Management: $4.6B Revenue, $4.04T AUM Record
Net revenues at AWM are $4.6B, an increase of 20% compared to last year. Management and other fees are at a record high of $3.4B, also up 20% compared to last year. Assets under supervision are at $4.04T record high, with $91B of long-term net inflows in the most recent quarter, and 34th straight quarters of net inflows. Alternative assets under supervision were at $459B as of the end of the quarter, with private equity holdings reporting gains. A record $59B of third party alternative fundraising was achieved this quarter.
Platform Solutions: Headwind From Apple Card Markdowns
Revenues for Platform Solutions were $221M, down 64% compared to last year, due to markdowns to the Apple Card loan portfolio due to credit losses and risk provisioning adjustments. This business is under strategic review. Profits for the core wealth and banking services (Global Banking & Markets, AWM) remain the most profitable.
Capital Return & Dividend Increase: Board Raises Dividend 11% to $5.00
On July 13, the Board raised the dividend from $4.50 to $5.00 (an 11% increase) for the third quarter. The second quarter capital return included a strong buyback from the $4 billion buyback program. The strong capital generation of $6.63 billion in net earnings provides support for the dividend increase and the buybacks, all while the company maintains a strong, healthy balance sheet. Total loans amount to $261 billion, and the book value per share increased by 1.8% to $367.67.
Technical: Support $1,001.85, Resistance $1,035-$1,045, Triangle Consolidation
From the technical analysis, GS trades at $1,039.40. Support at $1,001.85 has been defended, and a buy is in. the stock has consolidated in a symmetrical triangle, which is the consolidation of the overall market.
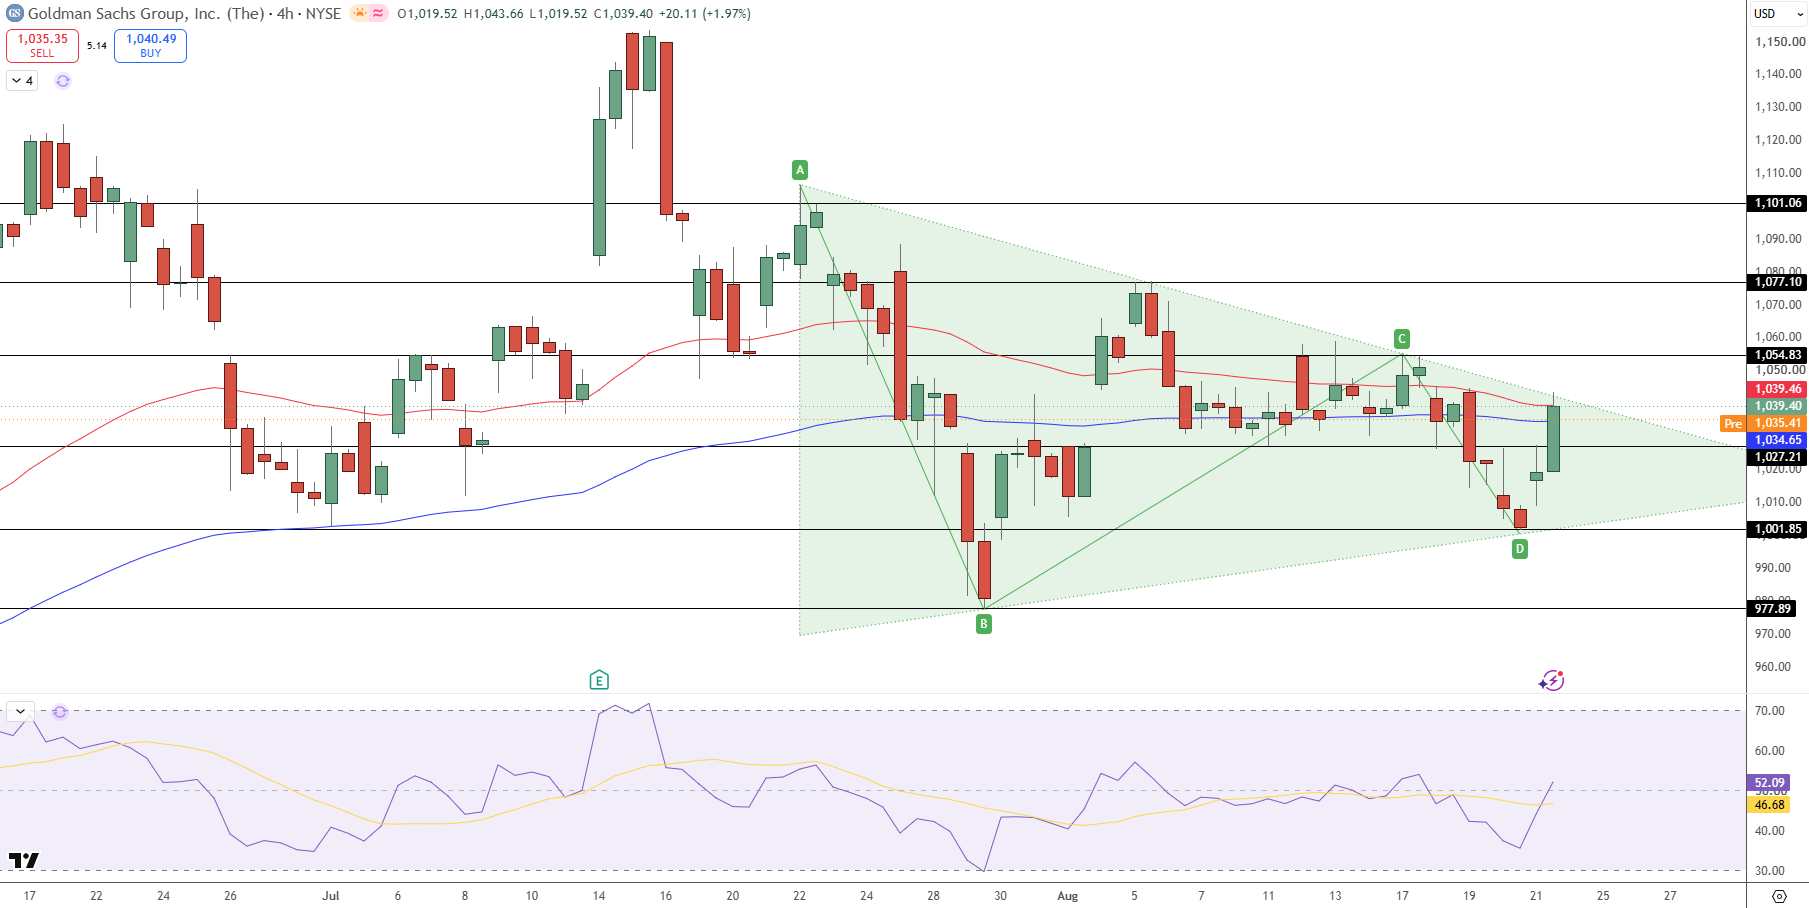
Goldman Sachs Price Chart - Source: Tradingview
A test of $1,035 - $1,045, the upper boundaries of the triangle and of the consolidation is next, the moving average indicates this. The RSI is at 52 (was at 47 and returned to neutral 50). Buying pressure is building and a break of $1,055 will set a new target of $1,077 and $1,101. The first support after $1,027.21 is $1,001.85.
Key Levels
- Support: $1,027.21, $1,001.85 (critical), $977.89 (breakdown level)
- Resistance: $1,035-$1,045 (cluster), $1,054.83, $1,077.10, $1,101.06
Bottom Line: Record Profitability, M&A Backlog High, Dividend Confidence Strong
Goldman Sachs has entered a new cycle where higher profitability is driven by strength in equities trading and M&A advisory services. With AI infrastructure being a multi-year opportunity and a five-year-high M&A backlog, there is positive outlook until 2027. The recent dividend hike shows management's confidence on delivering high returns. Risks include a slowing economy, reduced volatility (Equities trading heavily depends on market volatility), or M&A fatigue. The stock is technically consolidating and has formed a triangle. A break above $1,055 will target $1,077-$1,101. This is analysis, not investment advice.
Recommended Articles








Comments (0)
Click the $ button, enter the symbol, and select to link a stock, ETF, or other ticker.