


Amazon Stock Price Forecast: Morgan Stanley Says AWS Business Could Push Stock to $500 by End of 2027



AI Podcast


Morgan Stanley maintains an Overweight rating on Amazon with a $335 target, citing substantial upside from the AWS cloud business. Driven by significant computing capacity expansion, AWS revenue could surpass $1 trillion by 2035, supporting a potential stock price of $500 by late 2027. Despite current long-term growth prospects, Amazon's stock has pulled back below $260 following its August all-time high, currently testing crucial short-term support near the 80-day moving average and the 0.5 Fibonacci retracement level ($256.68). Holding this support zone is vital for bulls to stabilize the recent correction.

TradingKey - Amazon (AMZN) stock price has pulled back continuously since hitting an all-time high of $287.20 on August 3, and currently has fallen below $260.
Morgan Stanley analyst Brian Nowak, in his latest report, gave Amazon a target price of $335, implying a 30% upside from its current stock price, and maintained an "Overweight" rating. The report noted that if Amazon's AWS business continues to grow along its expected trajectory, Amazon's stock price could reach $500 by the end of 2027.
Morgan Stanley estimates that Amazon will add 6 to 8 gigawatts (GW) of computing capacity between 2026 and 2027, and expand at a pace of adding approximately 8 GW annually thereafter, driving total AWS computing capacity from about 14 GW in 2025 to about 120 GW in 2035.
Building on this, the key to AWS revenue growth lies in the monetization efficiency of its computing capacity. Morgan Stanley calculates that if annual revenue per additional watt of capacity increases to $12, AWS revenue could surpass $1 trillion in 2035; if monetization efficiency further rises to $14 to $15, this target could be achieved as early as 2034.
Morgan Stanley believes Amazon's current stock price has not yet fully reflected this long-term earnings potential. The report pointed out that if approximately $500 billion in long-term EBIT is discounted to 2028 at a 10% weighted average cost of capital (WACC), and then capitalized at an EV/EBIT valuation multiple of about 21x, an implied stock price of around $500 by the end of 2027 is derived for Amazon. This valuation multiple remains about 10% lower than the peer average of around 23x.
Morgan Stanley noted that this valuation discount itself implies further upside potential for Amazon. The report suggests that better-than-expected AWS revenue growth, sustained margin expansion, and operating leverage from retail growth and improved logistics fulfillment costs could all unlock further upside potential.
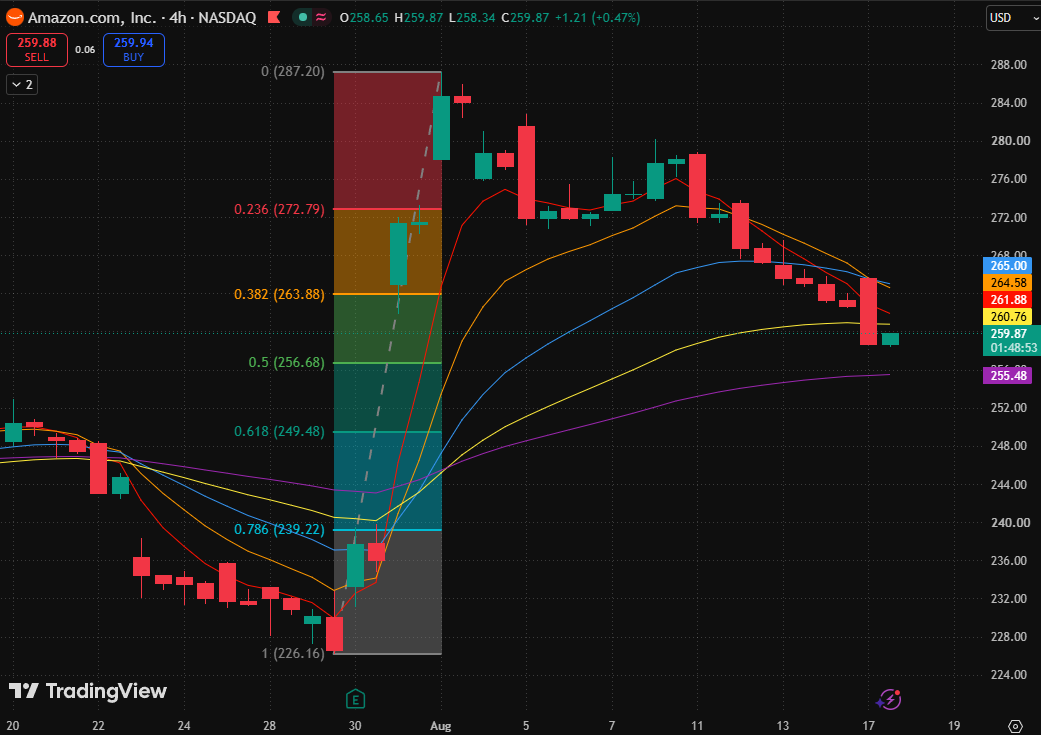
Amazon four-hour candlestick chart, Source: TradingView
Looking at Amazon's stock chart, it is currently in a pullback correction phase following a post-earnings surge. The stock price has weakened continuously after setting a new high, breaking below the 5-day, 10-day, 20-day, and 40-day moving averages, and is currently testing the 0.5 Fibonacci retracement level ($256.68) and the vicinity of the 80-day moving average, entering a key short-term support verification zone.
The previous earnings-driven gap up quickly pushed the stock price to $287.20, but it failed to consolidate at high levels and instead fell back below the 0.382 Fibonacci retracement level ($263.88), indicating that short-term profit-taking and adjustment pressures still dominate.
The current 0.5 Fibonacci retracement level ($256.68) serves as the midpoint of this upward move and forms a support zone near the 80-day moving average. Holding this level effectively would help bulls maintain the rebound structure, and the correction may shift into a technical consolidation.
On the downside, a break below $256.68 could trigger further profit-taking from capital that chased the post-earnings rally. The next support level to watch is the 0.618 Fibonacci retracement level ($249.48); lower down, the 0.786 Fibonacci retracement level ($239.22) comes into view.
This content was translated using AI and reviewed for clarity. It is for informational purposes only.
Recommended Articles











Comments (0)
Click the $ button, enter the symbol, and select to link a stock, ETF, or other ticker.