


Intel Stock Forecast: UBS Says $20 Billion Financing Plan Eliminates Long-Term Stock Uncertainty, INTC Enters Breakout Validation Phase



AI Podcast


On August 13 Eastern Time, Intel stock surpassed $105, driven by a $20 billion financing plan that UBS believes removes key uncertainties and funds its foundry capex via major client commitments. Meanwhile, BofA raised its 2030 server CPU TAM forecast to over $210 billion, though projecting Intel's market share to decline to 22% amid rising ARM adoption. Technically, Intel exhibits short-term bullish momentum, trading above key moving averages and approaching the $106.85 resistance. Sustained volume is required to confirm a breakout toward $113.66, while $101.49 acts as critical support to maintain the rally.

TradingKey — On August 13 Eastern Time, Intel (INTC) saw its stock price break above the $105 mark. The catalyst behind the stock's rally is Intel's recently announced $20 billion financing plan.
UBS stated that the $20 billion financing plan announced by Intel this week has likely eliminated the long-standing uncertainty hanging over its stock price. The bank's analyst Timothy Arcuri pointed out that, combined with the prepayments and financial commitments attached to several foundry agreements Intel is finalizing—with Google believed to have partnered on EMIB-T technology, Apple involved in M-series chips, alongside AMD, SpaceX, and potential other clients—this round of financing is sufficient to support the continued capital expenditure for its foundry business.
Arcuri emphasized his long-term bullish stance on Intel's process metrics and yield curve progress on the 14A node (which, unlike 18A, is essentially an optical shrink of the process node), believing that this node possesses a wider process window and should offer stronger appeal to external customers.
Meanwhile, BofA Securities raised its 2030 server CPU total addressable market (TAM) forecast to over $210 billion, an increase of more than 20% from its previous projection of approximately $170 billion, and upgraded the expected compound annual growth rate (CAGR) from 30% to 36%.
BofA expects the CPU-to-GPU ratio to narrow from approximately 1:4 during the training era to about 1:2 in the AI inference stage, eventually approaching 1:1 in the agentic AI era. This implies that by 2030, CPUs will account for about 10% of the overall data center system TAM of roughly $2.2 trillion, up from less than 7% during the 2024–2025 training era.
However, BofA noted that based on market share projections, the ARM ecosystem will be the biggest winner. BofA estimates that by 2030, commercial ARM CPUs (including Nvidia Vera, ARM AGI, Qualcomm CPUs, etc.) will account for about 38% of server CPU value share, while custom ARM CPUs (including AWS Graviton, Google Axion, Microsoft Cobalt, etc.) will account for around 9%, making a combined total close to 47%.
AMD is expected to maintain a value share of around 31%, while Intel's share is projected to decline from approximately 34% in 2026 to about 22%, even though its absolute revenue will still grow at a CAGR of about 22%.
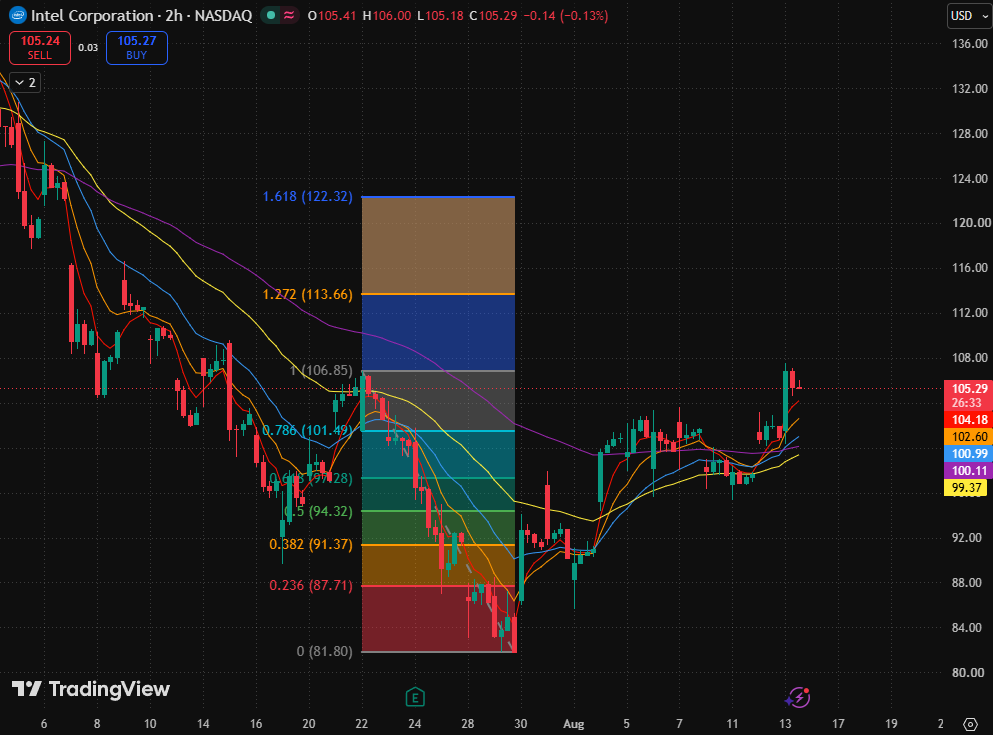
Intel two-hour stock price chart, Source: TradingView
Intel's stock price has continued to recover after finding a floor near its periodical low ($81.80), recently breaking above the 5-day, 10-day, 20-day, 40-day, and 80-day moving averages, with bulls dominating in the short term. The current price is approaching its previous high ($106.85), transitioning from a low-level rebound into a validation stage for breaking above the previous high.
In terms of moving averages, the 5-day and 10-day moving averages are accelerating upward, with the 20-day, 40-day, and 80-day moving averages positioned below the price, strengthening the short- to medium-term moving average structure. However, after a rapid surge, the price is now near the previous high and the overhead resistance zone, making a confirmed close above resistance far more critical than an intraday breakout.
Regarding upside space, if the stock price holds firmly above $106.85, the next target will be the 1.272 Fibonacci extension level ($113.66), with stronger resistance located at the 1.618 Fibonacci extension level ($122.32).
It is worth noting that INTC has strengthened consecutively and is approaching its previous high of $106.85; if trading volume is insufficient during the breakout, a pullback after a rally or a retest for confirmation may occur.
For short-term support, primary attention should be paid to the 0.786 Fibonacci retracement level ($101.49). Confluent with support near the 20-day and 40-day moving averages, this level serves as the core pivot for sustaining the current rally. If the price falls back below the 0.786 Fibonacci retracement level ($101.49), it would indicate weakening breakout momentum, and the pullback could extend toward the $97.28 area.
This content was translated using AI and reviewed for clarity. It is for informational purposes only.
Recommended Articles











Comments (0)
Click the $ button, enter the symbol, and select to link a stock, ETF, or other ticker.