


Super Micro Posted $60B Backlog and 15-17% Margin Guidance — So Why Is the Stock Testing $33.35?



AI Podcast


Super Micro Computer Inc. reported a transformative preliminary update, highlighted by a record $60 billion backlog and projected gross margin expansion to 15%-17%, effectively eliminating demand risk. These metrics signal a positive inflection point in scale and profitability, supported by a constructive technical setup with an RSI of 56. Final audited earnings will determine market direction; confirmation of preliminary figures could drive the stock toward $35–$36, while any divergence or earnings miss risks testing trendline support near $30.66. Execution and supply chain management remain critical risks for backlog conversion.
TradingKey -Super Micro Computer Inc. (SMCI) announced on July 21 preliminary results that changed the market narrative around the company. SMCI reported the receipt of $60 billion in new orders for Q4 and an improvement in gross margin to 15%-17% from the previously set narrow range of 8.2% – 8.4%. SMCI currently has a backlog of more than $2.2 billion. As SMCI is experiencing no demand risk from serving more than 20 enterprise and hyperscaler customers, these metrics show SMCI is clearly in an inflection point in scale and profitability.
SMCI’s stock is sitting at $31.86, consolidating in an upward trend, and RSI is at 56 (constructively rising but not overbought). The catalyst that will determine the next directional move for SMCI will be released tonight (August 10) after market close with the final results for Q2 FY2026.
The final audited results will determine if the July 21 preliminary results will be confirmed or if there will be a divergence. If confirmed, we can expect to see SMCI trading in the range of $34.97 – $36.79. If there is a divergence and the actual results miss, then SMCI could test the rising trendline at $30.66 – $30.95 as a trading range support level.
The July 21 Preliminary Update Changed the Narrative
In order to analyze SMCI’s current position, we look to the July 21 preliminary results. For SMCI’s Q4 FY2026, which ended June 28, more than $60 billion in new orders came in. This new record backlog extends more than two years of projected revenue at SMCI’s current run rate. The demand risk is completely eliminated as more than 20 large enterprise and hyperscale customers are served by this backlog.
The shocker was the margin guidance. Management now expects gross margins for the fourth quarter to be in the 15%-17% range, which is way up from the prior range of 8.2% to 8.4%. The swing is around 650 to 700 basis points, and indicates a substantial adjustment to the unit economics. The improvement in gross margins is attributed to the customer and product mix.
Again, in practice this language means that the higher margins are likely related to better customer mix and/or a shift away from offering commodity components toward rack-scale AI solutions. If this margin holds, SMCI will have a gross margin well above the previous estimates, and therefore will deserve a much higher valuation.
The Backlog Eliminates Demand Risk
The work to be done in the backlog totaling $60 billion deserves priority. If SMCI generates revenue at the rate of $10 billion per quarter, the current backlog is equivalent to six quarters, or 1.5 years of business. The backlog has a diverse customer and application base and spans hyperscaler AI infrastructure construction, private AI deployment by enterprises, and cloud provider capacity building. There is no concentration risk, and the visibility of the demand is outstanding.
The conversion risk is real, and SMCI will have to ensure it provides the fulfillment, manages the supply chain of components (especially GPUs and memory), and avoids production delays. The backlog of $60 billion eliminates the consideration of the presence or absence of demand. The only concern will be the execution.
SMCI Technical Setup: Rising Trendline Holding, $33.35 Breakout Looming
On the chart, SMCI keeps a positive chart structure on the 1-hour time frame. The stock trades around $31.68 as it has defended the rising trendline in recent trading sessions. After the bottom of July at $23.38, a series of lower lows indicates thatincreasing demand is occurring on pullbacks and suggests that the activity is not associated with selling by panic and is, in fact, related to buy side support.
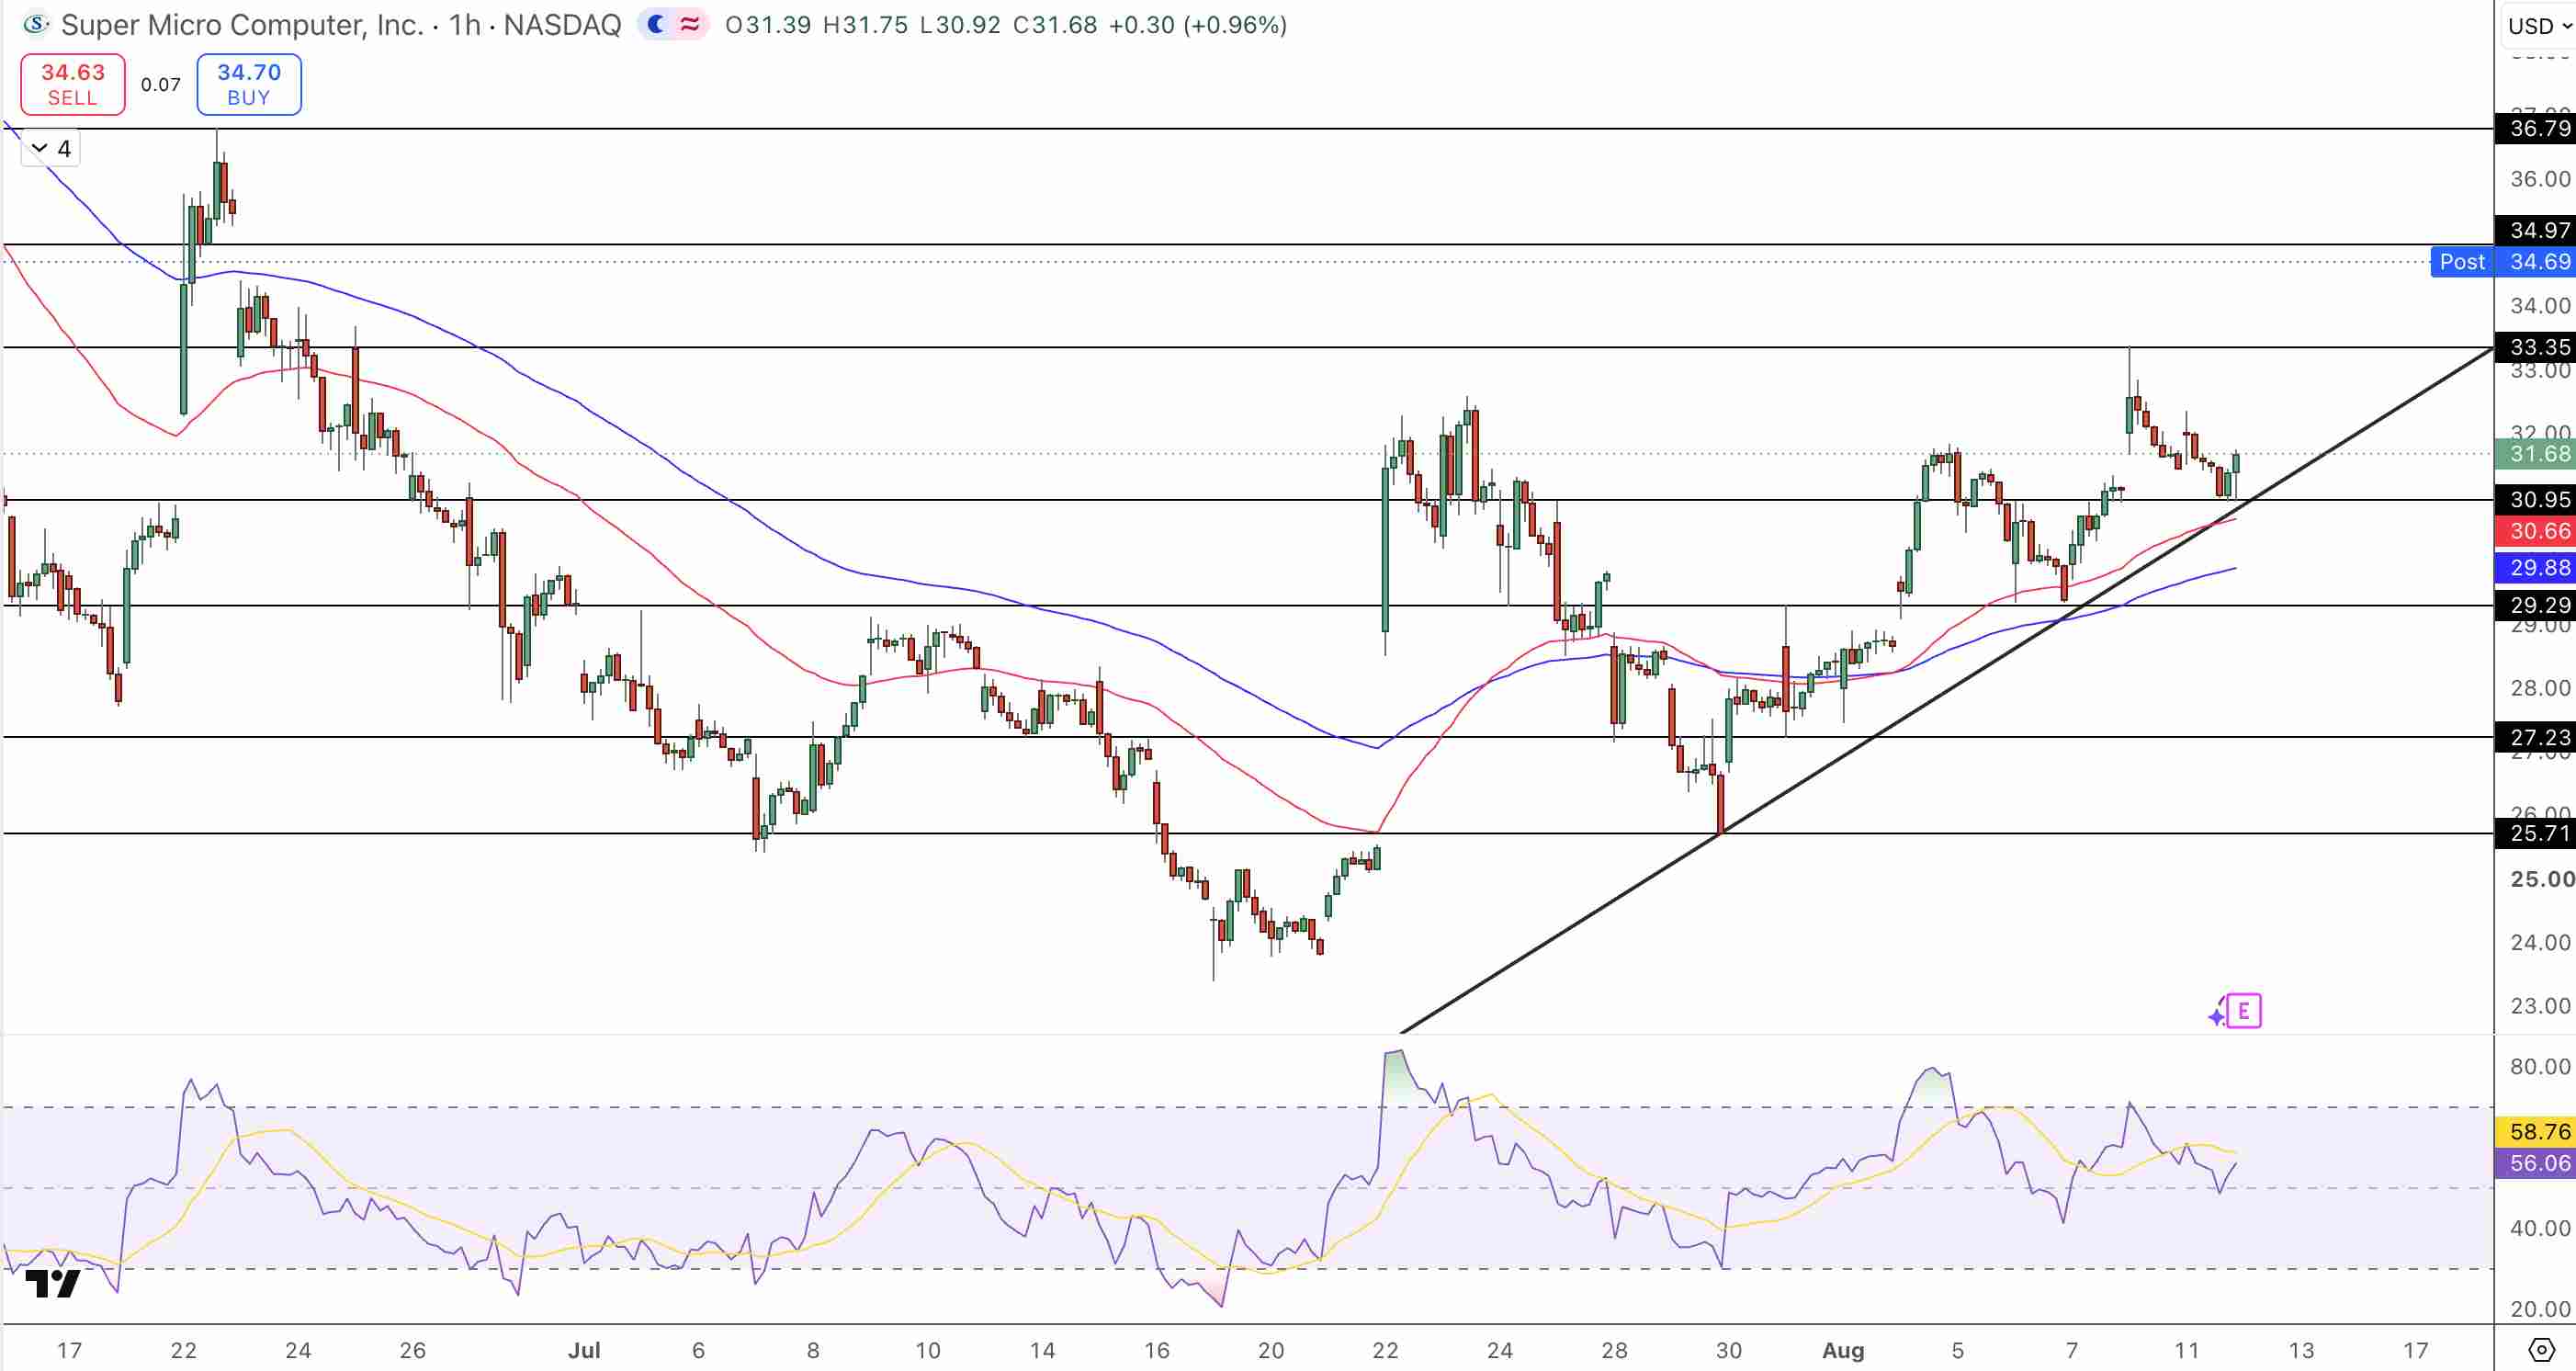 SMCI Price Chart - Source: Tradingview
A strong cluster of support is present at $30.95 as evidenced by the 50-day and 100-day moving averages. Demand is also exhibited at $30.66 and $29.88 respectively. RSI of 56 indicates there is still room for the stock to push higher and suggests that slightly higher levels likely will not provide resistance.
The next resistance level is $33.35, and a break higher from that level would likely lead to a resistance level at $34.97 - $34.69 and then at $36.79. This is the most important level to watch over the next 1-2 trading sessions.
Key Levels (Aug 10, Before Earnings Tonight)
- Immediate breakout level: $33.35 (swing-high resistance)
- Extended targets: $34.97–$34.69, $36.79
- Rising trendline support: $30.95–$30.66 (50 EMA)
- Secondary support: $29.88–$29.29 (100 EMA cluster)
- Downside if trendline breaks: $27.23
- Current price: $31.68 (testing consolidation)
- RSI: 56 (constructive, room to run)
What to Watch in Tonight's Q2 FY2026 Earnings (After Market Close)
Here are some areas of interest in the full, audited Q2 results due after the close tonight. The areas of interest surrounding Q2 results include: (1) Will revenues for the period come in at the lower bound of the $11.0B to $12.5B range? (2) Will the gross margin be confirmed at the 15-17% range or will it revert to the 8-9% range? (3) Will sustained margin improvements be evidenced by the previously mentioned beat or will it prove to be an anomaly? (4) Will the management team confirm the $60B backlog, or will it adjust the backlog estimate?
(5) Will the company provide any forward looking FY2027 guidance? If SMCI beats expectations and maintains margin guidance in this range, the stock could trade above $33.35 and test the $35 to $36 range. Conversely, if the quarter comes in below expectations and the margin guidance is adjusted, the stock could test the rising trendline support in the $30.66 range.
The Valuation Question
For the time being, SMCI is valued well below the $62.36 peak it hit in June. However, SMCI is priced above the $7 billion equity raise that was recently done at the expense of share dilution. If the gross margins expand to the 15-17% range and the company is able to convert even a portion of the $60B backlog at these improved gross margins, the valuation would be justified. Obviously, if the gross margins revert to the 8-9% range, the stock is still priced above historic norms.
The Bottom Line
Super Micro's preliminary update from July 21 revealed a $60B backlog and information regarding 15-17% margins and the prospect of structural margin expansion. From a technical perspective, price has been holding above the rising trendline and Super Micro has made a series of higher lows, and it has now broken through the $33.35 level. RSI at 56 indicates some uptrend potential without being overbought.
Looking at this overall, the technicals are quite bullish. However, the main focus is likely going to be the actual earnings call scheduled for tonight. If the actual numbers end up aligned with the preliminary guidance, then price could break the $33.35 level and go after the $35-$36 range. If the guidance is not met and earnings fall short, then price could drop to the rising trendline support in the $30.66-$30.95 range.
From a trading position, to be defended, that support line is now $30.95 and $33.35 is the breakout level. For a longer, more buy and hold position, hold off on any trading activity until we get actual guidance from the earnings calls tonight.
Recommended Articles












Comments (0)
Click the $ button, enter the symbol, and select to link a stock, ETF, or other ticker.