


SpaceX Stock Price Forecast: Returns to $135 Offering Price, Can It Rise Further?



AI Podcast


On August 10, Eastern Time, SpaceX reached a $1.76 trillion market cap after testing $135, though it subsequently pulled back. Analyst Chris Camillo warns the valuation is highly speculative, arguing current prices fully discount future successes in AI and space ventures without material fundamental changes. Technically, the stock remains in an ascending channel but faces selling pressure near $132.57–$135.52. While the short-term trend is strong, a failure to hold above these levels may trigger consolidation. Key support lies at $126.70, serving as the crucial bull-bear line for the current breakout structure.
Tradingkey - On August 10, Eastern Time, SpaceX ( SPCX) briefly returned to its IPO price of $135 intraday, before turning down by over 1%, bringing its latest market capitalization to $1.76 trillion. However, just two trading days ago, the company's stock price was still hovering around $105.
Veteran investor Chris Camillo stated that SpaceX is a "highly speculative play," noting that investors have already assumed Elon Musk can deliver on his ambitious artificial intelligence and space projects, which could take years to prove out.
Camillo said that before SpaceX went public, institutional and wealthy investors had multiple opportunities to privately buy the company's shares at valuations of hundreds of billions of dollars, and "almost nothing material has changed" to justify the current valuation multiples.
Camillo noted that SpaceX was valued at around $30 billion when he initially invested, as he believed its satellite business alone could eventually exceed that value. Today, however, "the valuation doesn't make sense unless investors are relying on a theoretical business that might not take shape for many years to come."
Camillo stated that even if SpaceX eventually achieves its most ambitious goals, the current valuation has already fully priced in these prospects of success. He said: "Unless there is a fundamental change, there is no way SpaceX will ever be an investment in my portfolio."
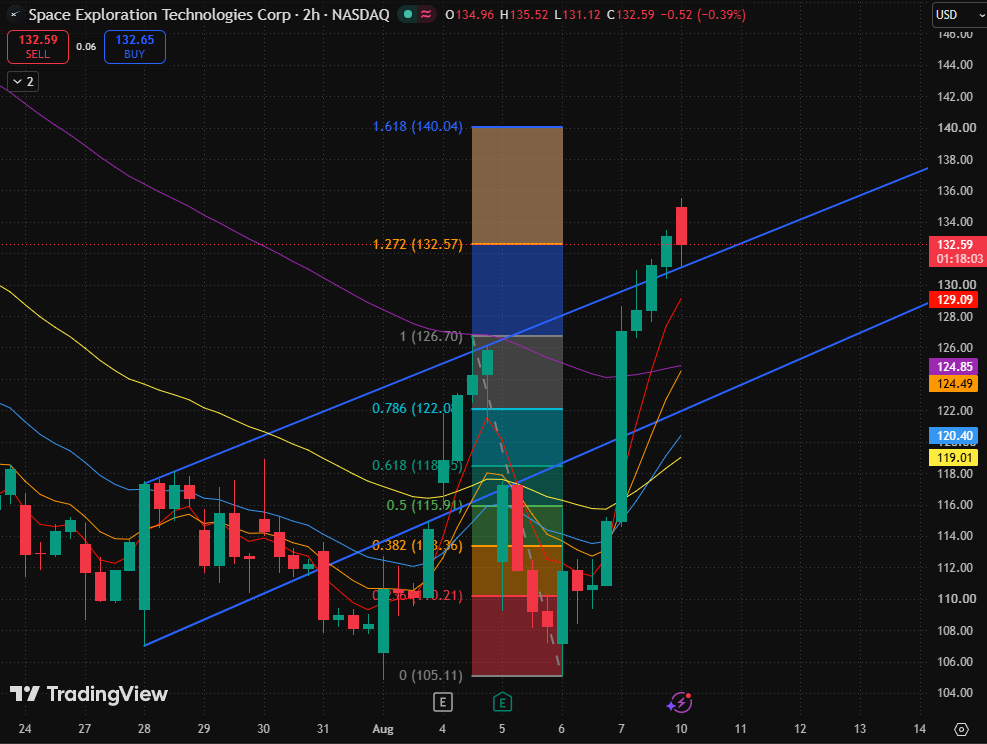
SpaceX two-hour stock price chart, Source: TradingView
Looking at the SpaceX stock chart, the price continued to move upward after breaking through the previous high ($126.70), briefly testing $135.54 intraday. The stock price is still running within an ascending channel, with the short-term trend remaining relatively strong. However, the latest candlestick showed a pullback after a high run, and has approached the 1.272 Fibonacci extension level ($132.57), indicating that profit-taking pressure from above is beginning to emerge.
However, in the short term, the stock price has clearly moved away from the moving average support zone and touched the vicinity of the upper boundary of the ascending channel. The latest candlestick, which retreated after surging high, reflects that selling pressure in the $132.57–$135.52 area is beginning to increase. If it fails to achieve consecutive closes above this region, the stock is more likely to enter high-level consolidation or a pullback for confirmation in the short term.
In the short term, the primary support is at the previous high ($126.70), which is also close to the lower support of the ascending channel and the 80-day moving average, serving as the core bull-bear line of this breakout structure. If it can hold firm after a pullback, the foundation for the upward trend remains intact. Below that, the second support level to watch is the 0.786 Fibonacci retracement level ($122.09), with further support at the 0.618 Fibonacci retracement level ($118.45).
On the upside, if the stock price can effectively establish a foothold above the 1.272 Fibonacci extension level ($132.57), the next target will point to the 1.618 Fibonacci extension level ($140.04); meanwhile, the latest high near $135.52 is the near-term resistance that needs to be digested before a breakout.
Only a stable close above $132.57 and a breakout above $135.52 will provide stronger confirmation that the upward trend is extending toward $140.04.
This content was translated using AI and reviewed for clarity. It is for informational purposes only.
Recommended Articles











Comments (0)
Click the $ button, enter the symbol, and select to link a stock, ETF, or other ticker.