


Intel (INTC) Stock Price Prediction: Perplexity Chose Nvidia Over Intel — Can $113 Hold Into July 23 Earnings?



AI Podcast


Intel shares recently retraced to $113.50 amid a broader semiconductor sector correction. While technical indicators show the stock holding above its $108.66 EMA200 support, fundamental pressure persists. Perplexity AI’s preference for Nvidia’s Vera chip over Intel’s Gaudi 3 underscores ongoing AI performance gaps, despite Intel’s focus on foundry expansion. Investors are closely monitoring the July 23 earnings report for updates on 18A manufacturing yields and foundry revenue growth. Success in these areas is critical to sustaining a bullish case toward the $141.40 target, while failure to hold the EMA200 could signal further downside risk.

TradingKey - Intel Corp. (NASDAQ: INTC) is now selling for $113.50 as it retraces the $104 to $106 range it hit July 8, after the semiconductor sector sold off following the Philadelphia Semiconductor Index's 10.8% loss in 10 sessions. The stock is above the EMA200 ($108.66) on the 4H, which has broken out, RSI at 48.37 is neutral, and buying has started to reappear in the breakout area.
Intel is getting another big piece of news this week, as Perplexity AI has chosen Nvidia's Vera chip over Intel and AMD following an AI direct inference test. This will solidify Nvidia's lead over Intel and AMD in inference performance. On July 23, Intel reports Q2 FY2026 results where we should hear more about foundry execution and 18A progress. Analysts on Wall Street have an average target of $100.18 (a Hold consensus), although the only HSBC Buy is $200 and Cantor Fitzgerald is on $150.
The Samsung Selloff and What It Means for Intel
In Samsung, preliminary Q2 results came in with 19X year-over-year growth in operating profit (up only 6% over expectations, according to DB), but unlike AMD and Micron, Intel has been hit more by a company-specific factor.
For AMD and Micron, the main reason for the selloff was their valuation, since they had both risen more than 100% year to date. But Intel has been more plagued by company-specific factors, ranging from 18A manufacturing yield timeline concerns to $174 million Intel Foundry brought from external customers during Q1 but lost money operating on, and selective price increases for consumer CPUs and Xeon processors (both signals of cost pressure).
From a $142.35 high on June 30, Intel has lost 20% in the $113 area, after rallying 286% this year (with the market becoming more concerned about sector valuation and company-specific execution).
Next earnings report on July 23 will test the strength of support (the EMA200 at $108.66) to see if the stock falls below toward $100 average analyst target. The outlook for this quarter includes $13.8 to $14.8 billion in revenue, 39% non-GAAP gross margin, and $0.20 EPS (a further sign of the continued investment in foundry).
Notably, for Q1, Intel reported revenue of $13.58 billion (beating expectations 9.2%) and non-GAAP EPS of $0.29, a huge beat over consensus EPS of $0.01. Another EPS beat would drive the stock higher into $125.
Perplexity's Nvidia Decision Highlights Intel's AI Performance Gap
Perplexity AI opted for Nvidia's Vera rather than chips from AMD or Intel following a direct inference benchmark using tokens-per-second, a vital yardstick for business AI applications. Intel touts its Gaudi 3 accelerators and Xeon 6 CPU chips as cheaper inference solutions, but Perplexity's findings indicate that Nvidia still maintains a clear performance lead, meaning cost alone won't persuade AI-obsessed buyers.
This is distinct from Intel's longer-term foundry outlook, which is what bullish firms HSBC and Cantor Fitzgerald are betting on. Although Intel's foundry business is ramping up, such as custom Apple ASICs, Google TPU, and 18A-P risk production, its AI compute business continues to face Nvidia head-to-head. Intel's plan to increase the Santa Clara plant, the Apple foundry business, Google production, and Tesla hiring Intel engineering staff all contribute to the long-term view. July 23 earnings call should help shed more light on external demand and 18A customer.
INTC Technical Analysis: Channel at $113, RSI 48.37, Target $141.40
On 4H INTC at $113.50 is maintaining channel breakout from the EMA200 at $108.66, RSI 48.37 is neutral and green candles are absorbing at breakout point.
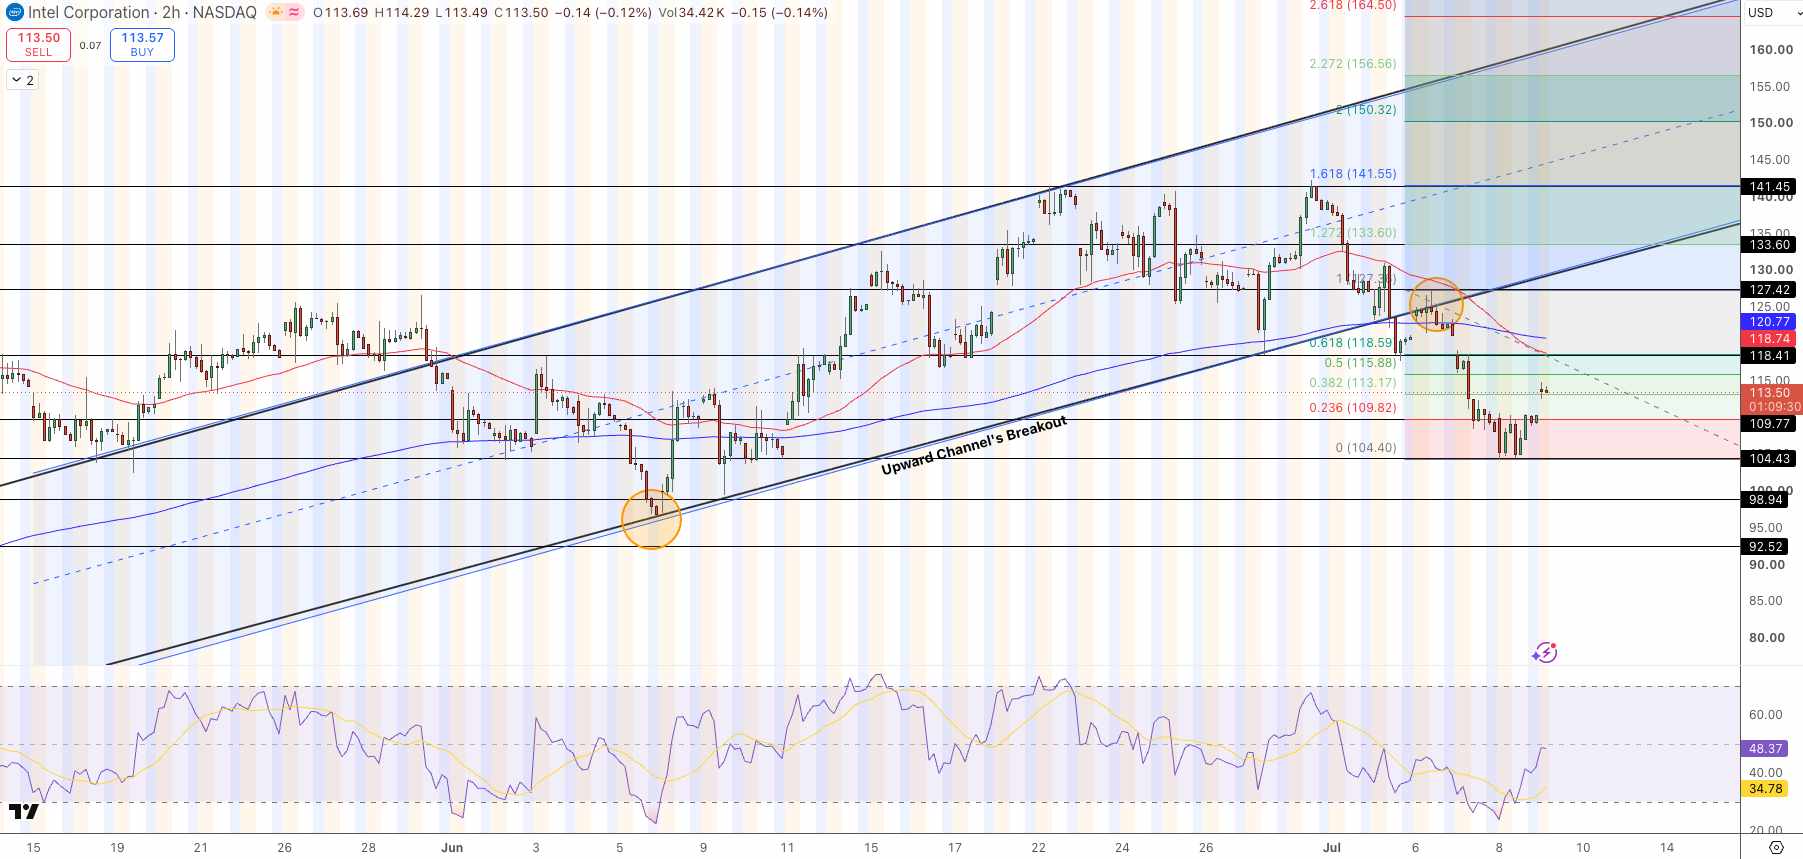
Intel (INTC) Stock Price Chart - Source: Tradingview
Fibonacci pullback from $104.40 low is in resistance at $115.88 (0.5) and $118.59 (0.382) with $133.60 (1.0) and $141.45 (channel target) as major upside. The breakout resistance above $125.70 confirms target of $141.40. Below $108.60 is risk.
- Entry: Long above $125.70 — breakout resistance cleared, moving averages reclaimed
- Target: $141.40 — channel extension, prior highs
- Stop Loss: Close below $108.60 — EMA200 fails
- Perplexity: Preferred Nvidia's Vera in benchmarking against Intel and AMD using inference speed.
- Q1 beat: $13.58B sales +9% YoY vs $12.43B expected. EPS was $0.29 vs expected $0.01 (beat by 2,108%)
- Q2 earnings: July 23 guided revenue $13.8-14.8B, non-GAAP EPS $0.20.
Why Did Intel Fall During the Samsung-Led Chip Selloff?
In the wake of Samsung Electronics' second-quarter profit forecast being pegged at around $58 billion, slightly higher than expected, several chipmaker shares were off the table as they were in a selloff. While Intel was not the laggard, the semiconductor industry has been a significant winner of the first half of the year. Intel was one of the first casualties, as some traders took profits and others were worried about the high price of the stock. The semiconductor index slid 10.8 percent over the last 10 sessions, after a 286% rally on the shares. The reasons for this decline included:
- The 18A yield timeline being delayed
- low foundry external revenue
- CPU price hikes
Why Did Perplexity Choose Nvidia's Vera Chip?
After conducting direct benchmarks of the AI inference performance (tokens per second) between Intel Gaudi 3 and Nvidia Vera, Perplexity chose Nvidia's Vera chip. Although Intel is touting the Gaudi 3 and Xeon 6 as cost-efficient solutions, the fact that Nvidia is still outperforming on the metrics that matter shows where the chipmaker is in the race for AI accelerators and the importance Intel puts on foundry growth in the long run.
What Should Investors Watch in Intel's July 23 Earnings?
Intel has forecast second-quarter revenue of $13.8 billion to $14.8 billion, a non-GAAP gross margin of around 39 percent and $0.20 in earnings per share. Investors are looking for more news about Intel foundry business revenue growth beyond the $174 million in first-quarter numbers, updates on 18A manufacturing yields and the commercialization plans for the manufacturing process, and developments around customer programs involving companies like Apple and Google. Intel's second consecutive earnings beat may help to strengthen a case for the shares to move toward the $125.70 breakout level.
Bottom Line
The shares of Intel recovered to $113.50 after the Samsung-led semiconductor correction. It also is trading above the 200-day exponential moving average of $108.66 and the RSI of 48.37. Perplexity's decision to use the Vera chip of Nvidia shows the challenge that Intel faces when it comes to AI inferencing, even as the long-term investment case relies on the execution of the Intel foundry strategy and analysts' confidence in its turnaround, as seen in the bullish price targets of $200 from HSBC and $150 from Cantor Fitzgerald.
Upcoming earnings report scheduled for July 23 and the growth in foundry customers and 18A commercialization process will be the next big catalyst. Intel is expected to break out to the $141.40 level if a breakout happens, and $108.60 is the key support level.
Recommended Articles











Comments (0)
Click the $ button, enter the symbol, and select to link a stock, ETF, or other ticker.