


Kioxia Shares Plunge Over 15% in Single Day to Lowest Since May



AI Podcast


On November 2, Japanese memory chip giant Kioxia (285A.JP) plunged over 14% to a six-month low of 11,210 yen, driven by a disappointing earnings outlook and fears that the memory chip cycle is peaking. Management warned of slowing NAND Flash price momentum, missing optimistic Wall Street forecasts. This sell-off was compounded by a broader U.S. semiconductor sector rout. Technically, the stock breached key moving averages and support levels, leaving the 10,000 yen psychological level as the next short-term defense line, with roughly 11% further downside risk.
TradingKey - Kioxia breaches defense line amid surge in selling pressure; stock plummets over 15% in a single day to hit new low since May this year.
On November 2, Japanese memory chip giant Kioxia (285A.JP) saw its stock plummet over 14% in a single day, drawing a long bearish candlestick with heavy volume on the daily chart. The stock fell to a low of 11,210 yen ($70.99), completely engulfing all of last week's gains and hitting a new six-month low since May 2026.
The main reasons for Kioxia's stock plunge were a disappointing financial outlook and concerns over the peaking of the memory chip cycle. Although Kioxia's latest quarterly revenue and profit remained high, management's earnings guidance for the next stage fell short of Wall Street's extremely optimistic expectations, warning of slowing upside momentum in NAND Flash contract prices, which directly triggered market panic over an early peak in the memory chip supercycle.
In addition, the U.S. semiconductor sector suffered a bloodbath last Friday, with the Philadelphia Semiconductor Index (SOX) plunging over 7%. Fellow memory giant Intel (INTC) slumped 28%, SanDisk (SNDK) crashed over 13%, and AMD (AMD) fell 10%.
The long bearish candlestick of over 14% in a single day pushed Kioxia's stock price below all daily and weekly moving averages, completely penetrating the bottom support band constructed in May. Technical analysis shows the next short-term defense line is at the support level aligned with the psychological round number of 10,000 yen, leaving approximately 11% downside potential from the current level of 11,340 yen.
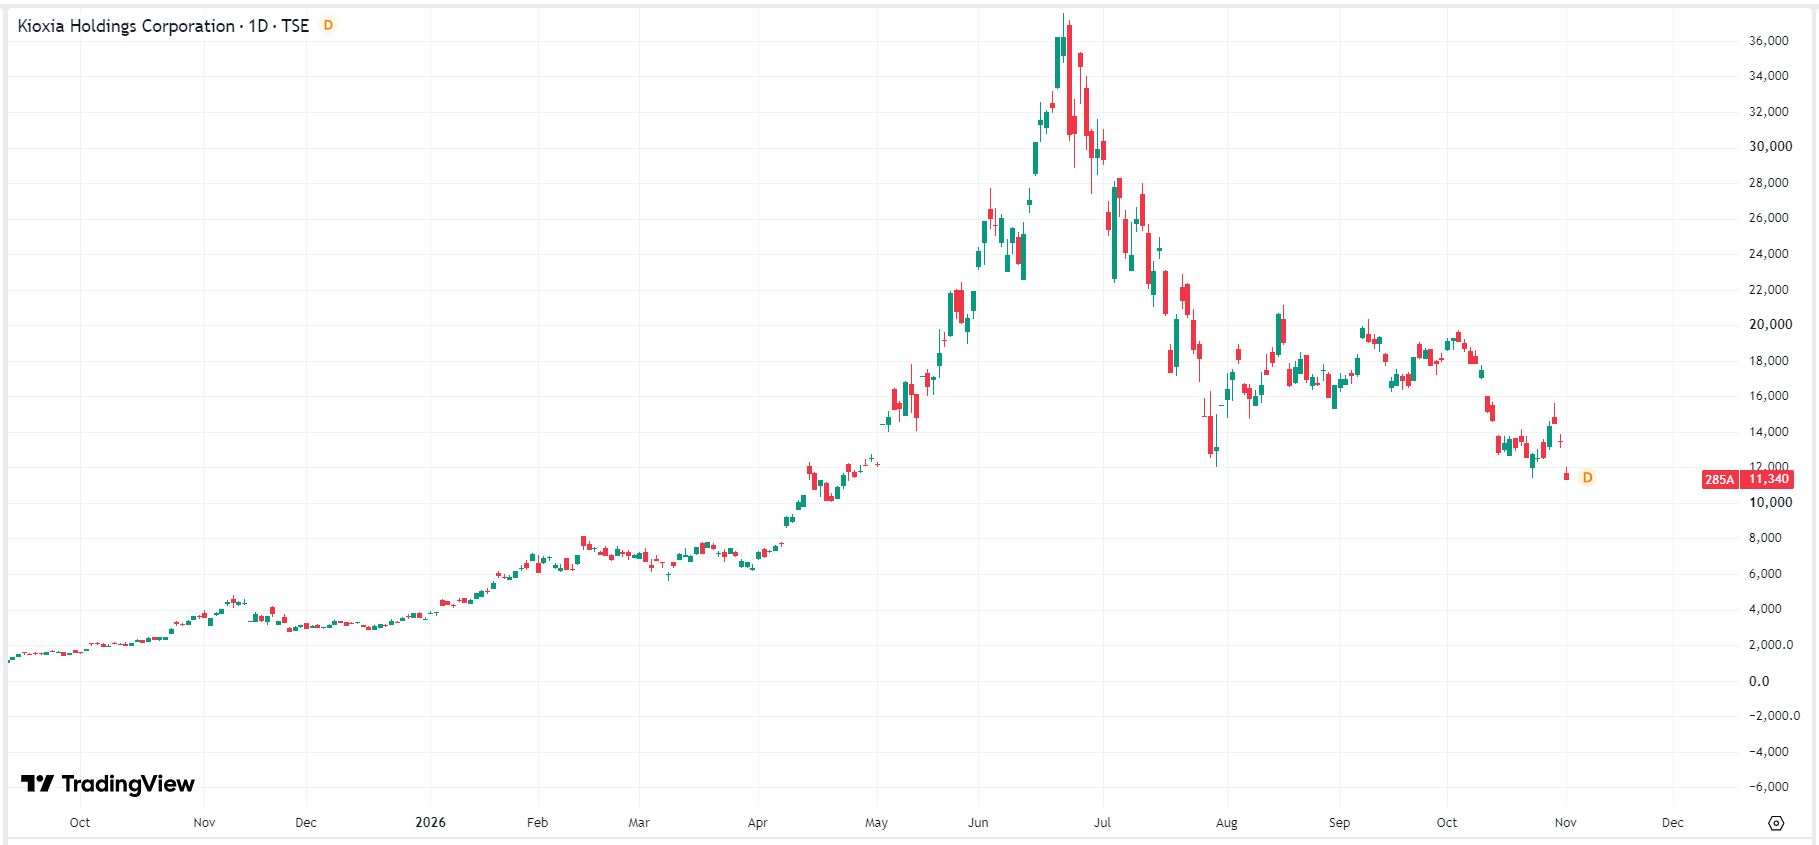 Kioxia stock price chart, source: TradingView
This content was translated using AI and reviewed for clarity. It is for informational purposes only.
Recommended Articles







Comments (0)
Click the $ button, enter the symbol, and select to link a stock, ETF, or other ticker.