


KOSPI Index Forecast: Goldman Sachs Cuts Target by 25% to 9,000, Near 5,000 Becomes Key Support



AI Podcast


The South Korean KOSPI Index has entered a range-bound phase near the 5,500 level following a sharp correction. Goldman Sachs lowered its 12-month target from 12,000 to 9,000 points, reflecting revised valuation and earnings expectations rather than a bearish stance. Technically, the RSI near 30.06 indicates oversold conditions, with strong support identified around 5,262.77 points. Sustained recovery depends on AI capital expenditures, semiconductor earnings, and global risk appetite, with immediate resistance anticipated at the 10-day and 20-day moving averages, while a breach of key support risks deeper downside adjustments.
TradingKey - The South Korean stock market has recently entered a range-bound phase following a sharp correction, with the KOSPI Index repeatedly fluctuating around the 5,500 level. The index previously pulled back rapidly from its intra-year high, and its short-term moving average structure weakened significantly, while recent rebound momentum remains insufficient to confirm a trend reversal. Against this backdrop, Goldman Sachs (GS) recently lowered its 12-month target for the KOSPI from 12,000 points to 9,000 points, a 25% reduction.
From the latest market trends, as of the close on October 26, the KOSPI Index closed at 5,469.47 points, down 1.46%. Goldman Sachs' forecast of 9,000 points is significantly higher than the current index level, indicating that this adjustment reflects a revision of valuation assumptions and earnings expectations rather than a turn to a bearish stance on South Korean equities. Goldman Sachs believes that current South Korean stock valuations already reflect relatively cautious earnings expectations, and subsequent developments will still depend on AI-related capital expenditures, semiconductor earnings, and changes in global risk appetite.
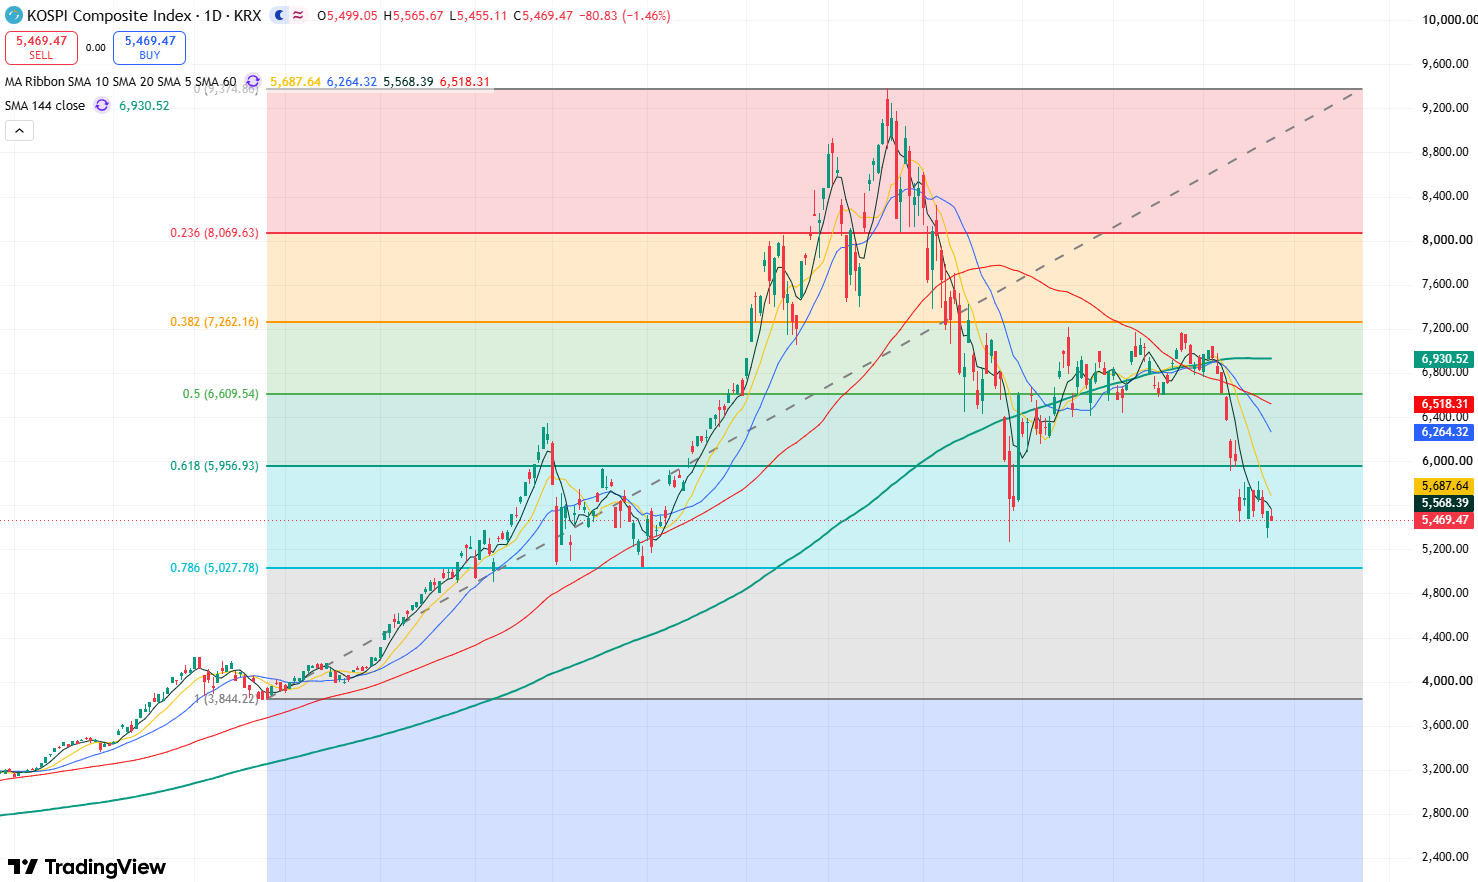
KOSPI Index daily chart, Source: TradingView
Looking at the daily chart of the KOSPI Index, the KOSPI has pulled back sharply from its previous intra-year high of 9,385.59 points, with a cumulative decline of over 40% from the peak. In October, the index briefly dropped near 5,300 points before rebounding, but it has not yet recovered its main medium-term moving averages.
Regarding moving averages, the index's recent performance has been continuously suppressed by the 5-day and 10-day moving averages, indicating that bears hold the upper hand in the market with strong downward momentum, and the possibility of further declines in the short term remains.
In terms of technical indicators, the Relative Strength Index (RSI) stands at 30.06, approaching oversold territory, while the MACD is also in negative territory, showing that medium-term downside momentum has not fully dissipated.
Currently, the index retested the July low of 5,262.77 in October without breaking below it, indicating certain support near this level. If the index confirms a bottom and stabilizes near 5,300, it will test the 10-day moving average (around 5,700) upward in the short term, followed by the 20-day moving average (around 6,200). If it can break through and hold above this level, the index will further test the resistance level at 6,600 points, with higher resistance at 7,200 points. Only by breaking through this level can the index potentially open up greater upside space.
Conversely, if the index falls below 5,262.77 points, it will open downside room toward the key support level at the 5,000 mark. If this level holds, the index may still maintain the possibility of challenging 7,200 points to the upside. If this level is lost, the index will enter a deeper adjustment phase, potentially falling further back toward around 4,200 points.
This content was translated using AI and reviewed for clarity. It is for informational purposes only.
Recommended Articles










Comments (0)
Click the $ button, enter the symbol, and select to link a stock, ETF, or other ticker.