


Crude Oil Price Forecast: Brent Falls Below $90 to Lowest Since Late August, Next Target May Point to $80



AI Podcast


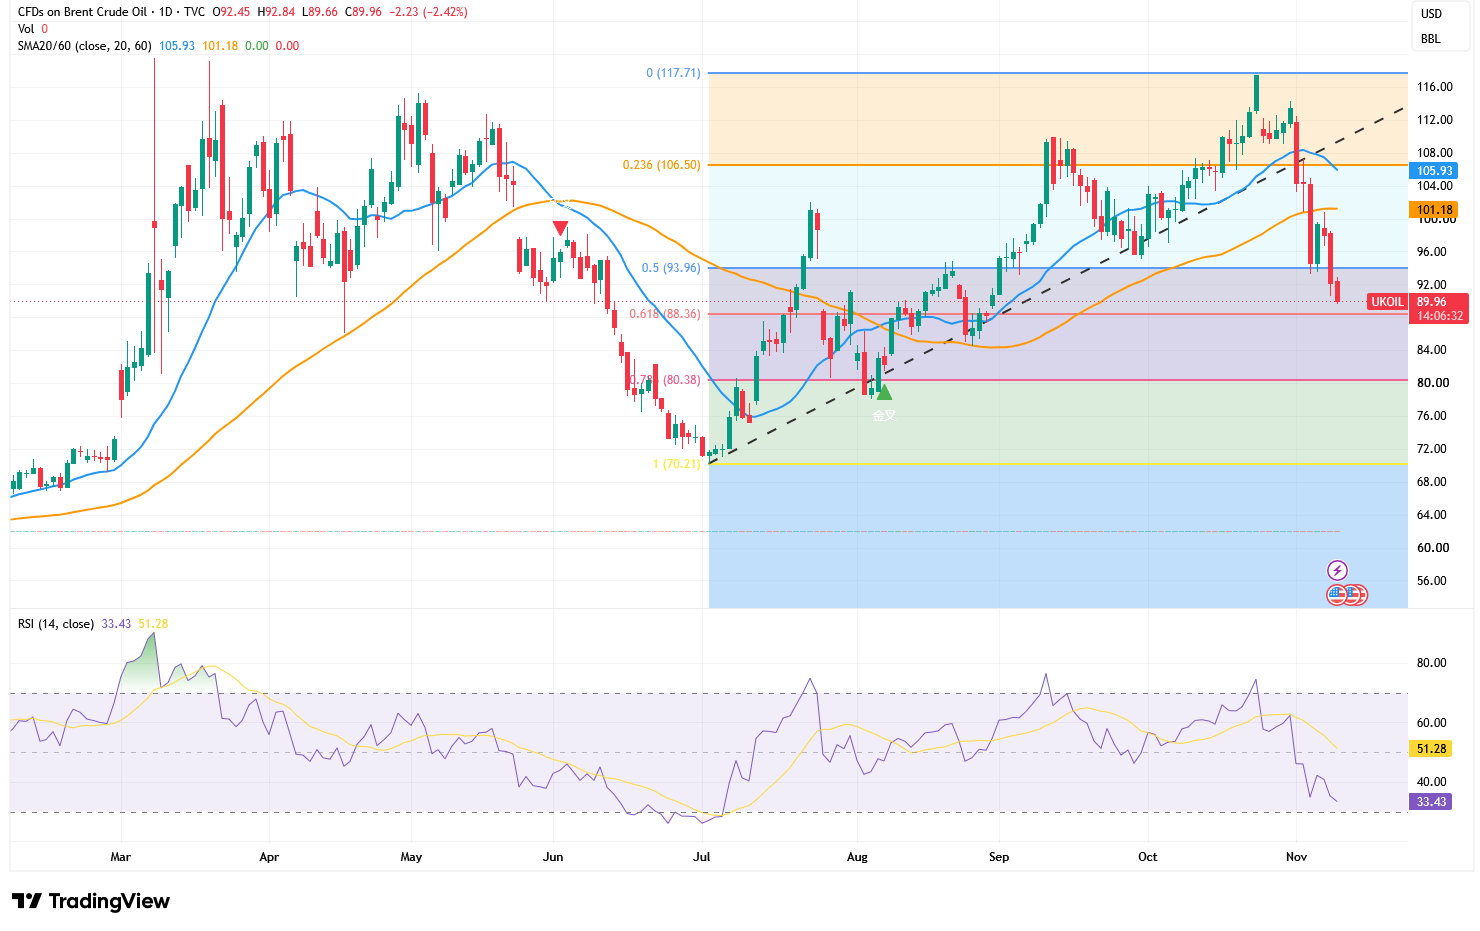
International oil prices fell to multi-month lows as easing U.S.-Iran tensions unwound geopolitical risk premiums, shifting market focus back to supply-demand fundamentals. Brent crude dropped below $90 per barrel, breaking key moving averages and the 50% Fibonacci retracement level, signaling clear bearish dominance. Technically, the 14-day RSI approaches oversold conditions at 33.43. While the $88–$90 support zone may spark a technical rebound, crucial overhead resistance at $93.96 and $101.18 must be reclaimed to reverse the medium-term downtrend. A confirmed daily close below $88.36 risks accelerating losses toward the $80.38 support level.

TradingKey - On November 10, international oil prices extended their downward trend, with Brent crude (UKOIL) futures falling below the $90 round-number mark, trading at $89.96 per barrel, while WTI crude (USOIL) futures retreated to around $84.36 per barrel. Both benchmarks dropped to their lowest levels since late August, signaling that the geopolitical premium previously driven by Middle East tensions is rapidly unwinding.
U.S. President Trump stated that military action against Iran appears unnecessary at this time. This remark lowered market expectations of a renewed escalation in the U.S.-Iran conflict and eased investor concerns over disruptions to Middle East crude production and transport. As the risk of near-term supply disruptions subsided, traders began unwinding previously established safe-haven positions, prompting oil prices to further surrender earlier gains.
ING analysts noted that the market is reassessing the U.S.-Iran situation, and as expectations of de-escalation strengthen, part of the risk premium priced into crude oil over the past several weeks continues to be squeezed out. Meanwhile, oil shipments along some Middle East shipping routes have shown signs of recovery, further reducing expectations of supply shortages. In the absence of fresh geopolitical shocks, the pricing logic for oil is gradually shifting from potential supply disruptions back to actual supply and demand fundamentals.
However, the situation in the Middle East has not fully stabilized. The foundation for negotiations between the U.S. and Iran remains fragile, and regional energy facilities and key shipping lanes still face potential risks. If talks stall again or oil production and transport infrastructure come under attack, the risk premium that has been discounted by the market could quickly return. Therefore, the current decline in oil prices reflects a reduced probability of conflict escalation rather than the complete elimination of related risks.
Source: TradingView
From a technical perspective, Brent crude has broken below the ascending trendline formed since its July low and lost the 50% Fibonacci retracement level at $93.96, damaging its prior medium-term upward structure. Crude prices are also currently trading well below the 20-day moving average of $105.93 and the 60-day moving average of $101.18. Both moving averages have begun turning downward, indicating that short- and medium-term trends are dominated by bears.
The most critical support level to monitor currently is at $88.36, which corresponds to the 61.8% Fibonacci retracement of this rally. Although Brent crude broke below $90 intraday, it has not yet decisively breached this support. If the $88 to $90 area can attract dip-buying interest, oil prices may first stage a technical rebound, with initial overhead resistance near $93.96. Only a sustained move back above $94 would likely slow the pace of the short-term decline.
If Brent crude confirms a break below $88.36 on a daily closing basis, it would signify a failure of the 61.8% retracement level, and the next downside target could shift to $80.38. Calculated from $88.36, a decline to that level would represent a potential drop of approximately 9%. The vicinity of $80 corresponds not only to the 78.6% Fibonacci retracement, but also to a high-volume consolidation zone formed between July and August, which is expected to serve as a more vital defensive line for the bulls.
Momentum indicators also reflect that oil prices remain weak. The 14-day Relative Strength Index (RSI) has dropped to 33.43, well below its smoothed signal line of 51.28 and inching closer to the oversold threshold of 30. This suggests that bearish momentum still holds the upper hand, though after consecutive declines, the risk of chasing short positions in the near term is also mounting. If the RSI dips into oversold territory while crude holds above $88, the market could see a temporary rebound driven by short covering.
However, approaching oversold conditions does not mean the downtrend is over. Under a markedly weakening trend, the RSI can linger at low levels for an extended period. Even if Brent crude rebounds from the $88 to $90 zone, it would need to reclaim $93.96 and $101.18 in succession to relieve current technical pressure. Within that range, the $100 to $101 area combines a psychological round-number threshold and the 60-day moving average, which is expected to pose formidable resistance; further above, the $105 to $106 zone remains a crucial hurdle that must be cleared before the trend can regain upside momentum.
This content was translated using AI and reviewed for clarity. It is for informational purposes only.
Recommended Articles











Comments (0)
Click the $ button, enter the symbol, and select to link a stock, ETF, or other ticker.