


Gold Tumbles Toward $4,000 as Hotter-Than-Expected CPI Boosts Fed Rate-Hike Bets, Bulls Eye $3,975 Support



AI Podcast


Gold prices rebounded slightly to near $4,040 during the Asian session on November 11, following a sharp 2.61% decline triggered by higher-than-expected U.S. October CPI data. Sticky core inflation and resilient labor market data elevated expectations for a Federal Reserve rate hike, driving up the U.S. dollar and Treasury yields. Technically, gold's short-term upside momentum has waned near the $4,150 resistance. Market attention focuses on the $4,000 support level; holding the crucial $3,975.48 threshold could preserve a potential head-and-shoulders bottom pattern targeting $4,200, whereas a breakdown risks further downside toward $3,900.
TradingKey - As of the Asian session on Wednesday (November 11), gold prices (XAUUSD) rebounded slightly after a sharp decline in the previous session, last trading near $4,040, up about 0.3% on the day. Earlier, the latest U.S. CPI released on Tuesday came in higher than market expectations, lifting the U.S. dollar and Treasury yields and putting short-term pressure on gold. Gold prices fell 2.61% that day, dropping to a low of $4,013.54 and approaching the $4,000 mark.
Fed December Rate Hike Expectations Rise Further as US October Core CPI Tops Estimates
Data released by the U.S. Bureau of Labor Statistics on Tuesday showed that U.S. headline CPI rose 0.4% month-over-month in October, exceeding market expectations of 0.3% but slowing from 0.6% in September, while core CPI rose 0.3% month-over-month, also above the market expectation of 0.2%. Although the pace of headline inflation eased from September, core inflation continued to show stickiness, indicating that underlying U.S. price pressures have not yet significantly abated.
Following the data release, markets swiftly adjusted their expectations for Federal Reserve monetary policy. Previously, Fed official Christopher Waller stated that he would support more aggressive policy action by the central bank if inflation data came in significantly higher than expected. After the CPI release, markets fully priced in the likelihood of a 25-basis-point rate hike by the Fed in December, while the probability of a 50-basis-point hike in December rose from 0% previously to about 10%.
Impacted by this, the U.S. Dollar Index rose about 0.56% to near 102.25. The U.S. 2-year Treasury yield rose about 18.44 basis points to 4.731%, and the 10-year Treasury yield climbed about 12.55 basis points to 4.988%.
A stronger dollar and rising U.S. Treasury yields were the primary reasons for gold's sharp decline following the CPI release. The dollar's gain raised the cost of gold for buyers holding other currencies, while higher Treasury yields increased the opportunity cost of holding non-yielding gold, jointly exerting downward pressure on gold prices.
Recent data also indicate that the U.S. labor market has shown strong resilience. Nonfarm payrolls increased by 165,000 in October, well above market expectations of 65,000, while the unemployment rate fell to 4.1%. The robust labor market, coupled with higher-than-expected core inflation, leaves the Fed with little justification to pivot toward an accommodative policy in the near term.
Gold Price Technical Analysis
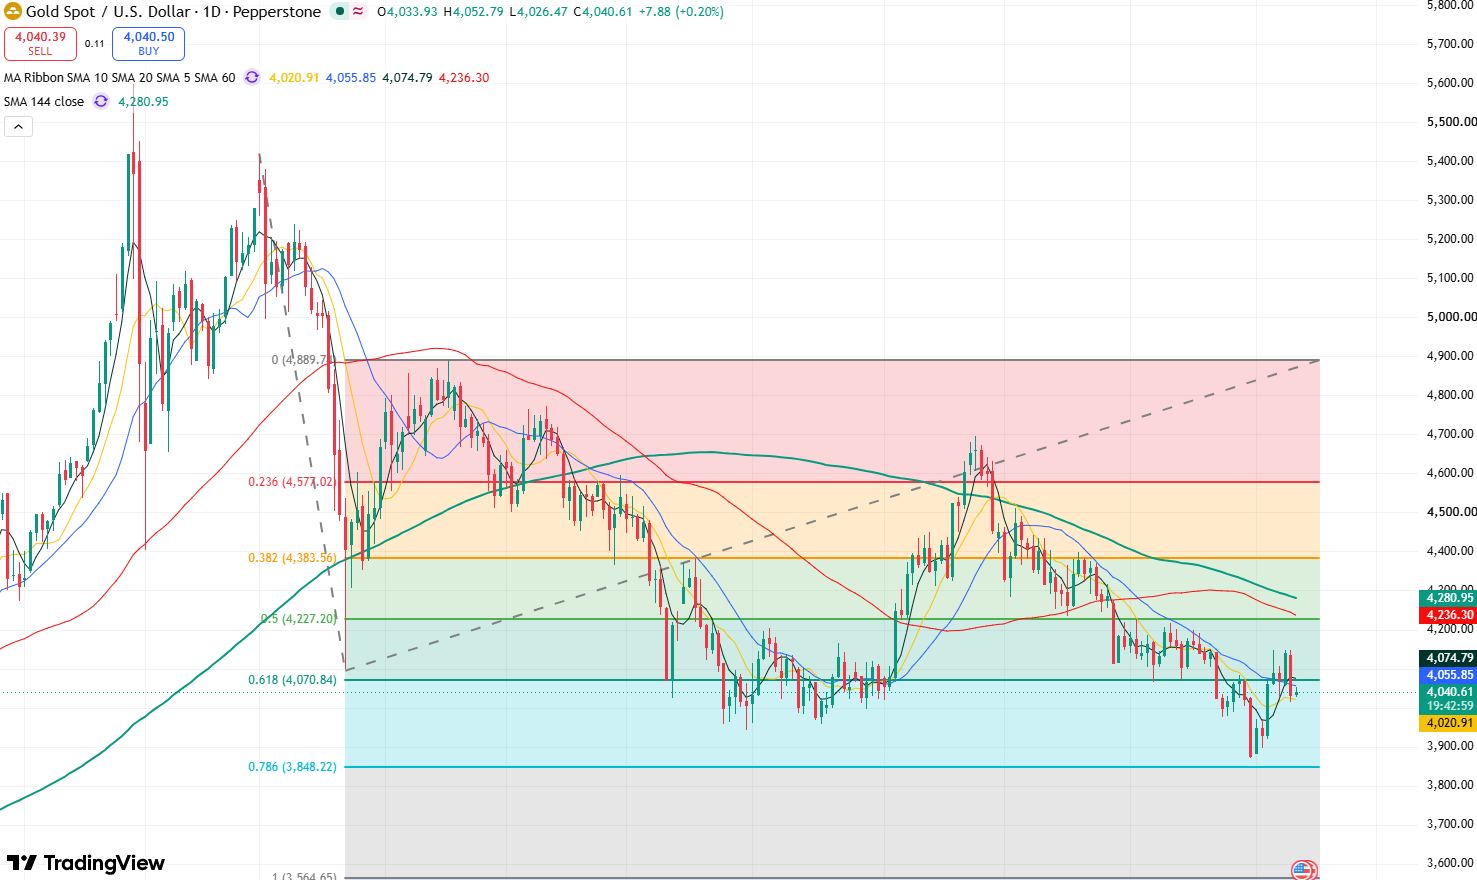
Gold price daily chart, Source: TradingView
On the daily chart, gold had previously rebounded sharply from near $3,870 to around $4,148, but met resistance in the $4,150 resistance zone. Following a higher-than-expected US October CPI, gold retreated rapidly on Tuesday, falling back below $4,050, with earlier rebound momentum noticeably waning.
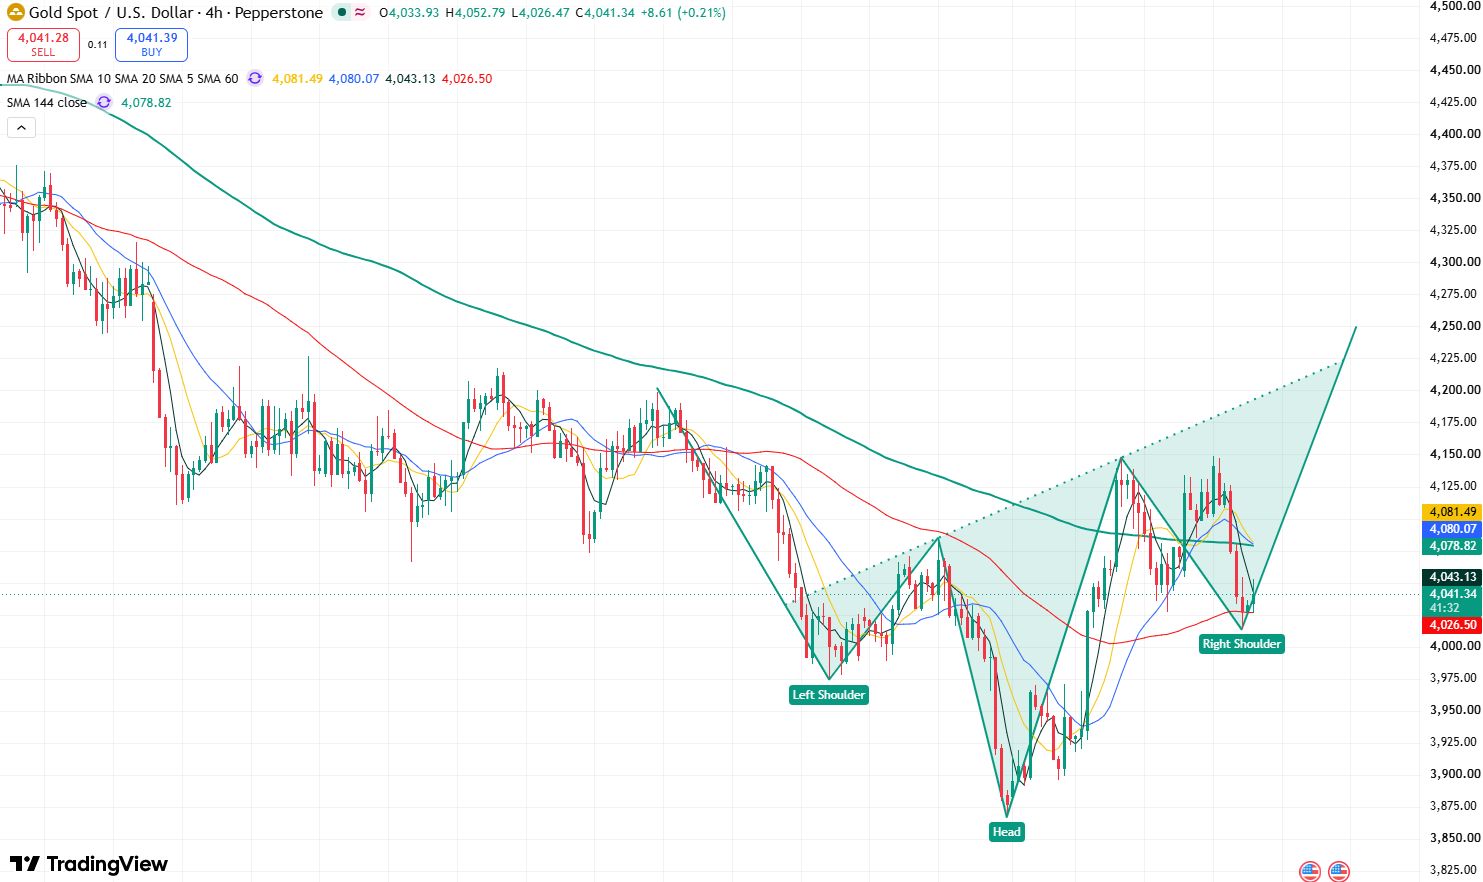
Gold price 4-hour chart, Source: TradingView
On the 4-hour chart, gold briefly broke above the October 28 rebound high of $4,082.89 during its previous strong rally, improving the short-term bullish structure while candlestick patterns suggest the potential formation of a head-and-shoulders bottom.
Currently, key attention should be paid to whether gold, weighed down by the bearish CPI impact, will break below the head-and-shoulders bottom's left-shoulder low of $3,975.48. If this level holds, the candlestick structure will form a head-and-shoulders bottom, significantly boosting short-term bullish momentum, with the primary upside target testing $4,200.
For now, the primary overhead resistance to watch is $4,150. A breakout above this level would open upside room toward $4,200–$4,230, with the $4,260–$4,300 resistance zone lying further above.
On the downside, the primary support to monitor is the $4,013–$4,000 range. If gold drops below $4,000, focus will shift to $3,975.48 below; if this level fails to hold, gold will retreat further toward $3,900.
This content was translated using AI and reviewed for clarity. It is for informational purposes only.
Recommended Articles









Comments (0)
Click the $ button, enter the symbol, and select to link a stock, ETF, or other ticker.