


Gold Price Forecast: Gold Rebounds Above $4,200, Can Falling Oil Prices Drive Another Rally?



AI Podcast


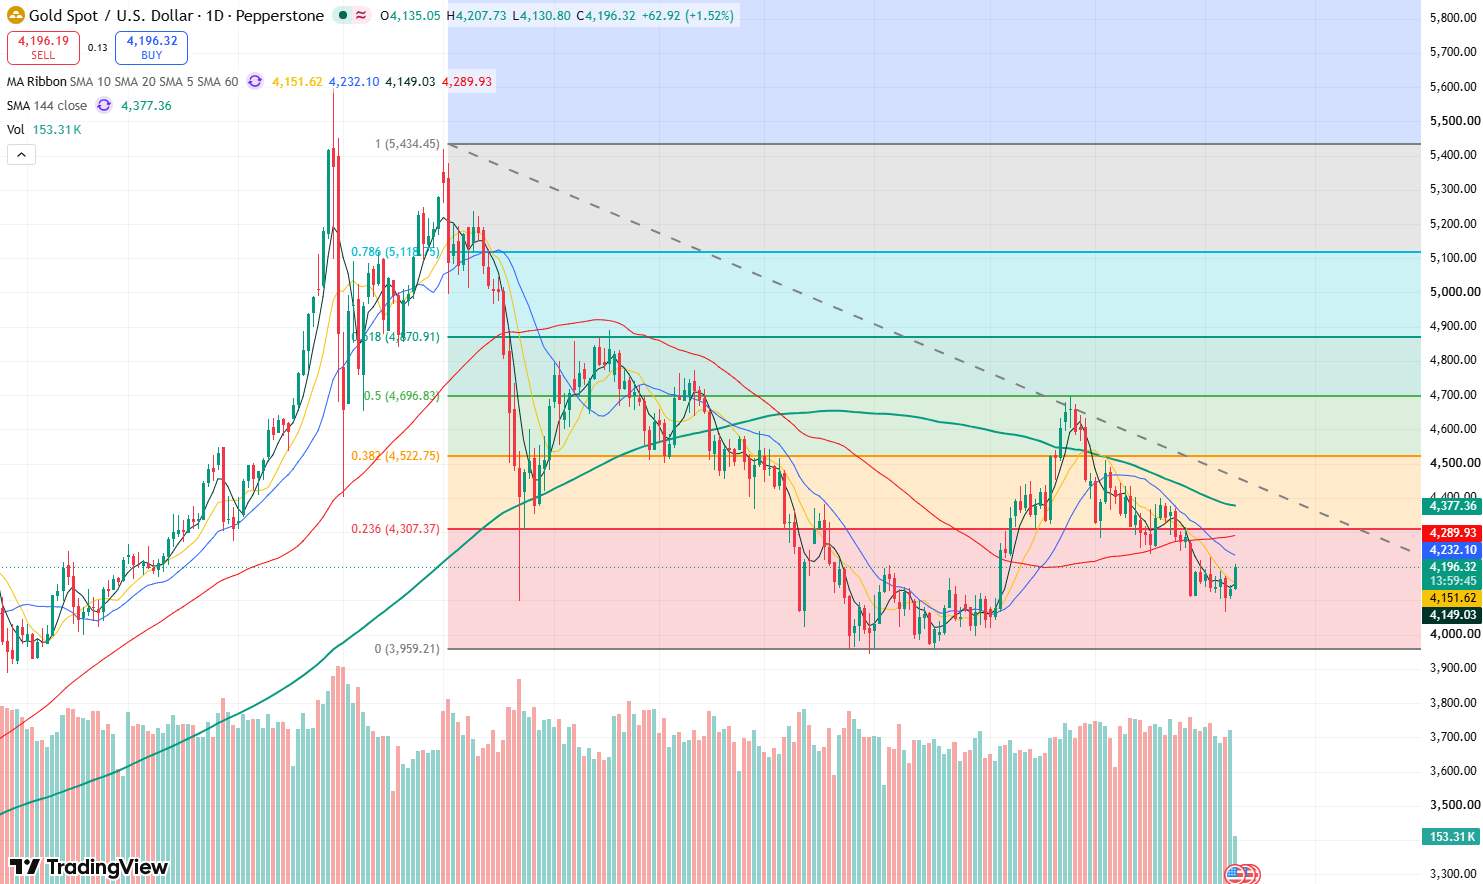
As of Friday (October 9), gold prices rebounded above $4,200, driven by declining US Treasury yields, a weaker US dollar, and lower oil prices following easing US-Iran tensions. This relief on inflation concerns moderated Federal Reserve rate-hike expectations, supporting gold's short-term recovery. However, persistent risks of a year-end rate hike remain depending on upcoming inflation data. Technically, gold has breached the 10-day moving average, signaling reduced downside momentum. Key resistance stands at the $4,230–$4,250 range, while primary support is located between $4,170 and $4,150. A break above $4,250 could target $4,300, whereas dropping below $4,150 risks retesting $4,100.

TradingKey - As of Friday (October 9), gold prices (XAUUSD) rebounded noticeably after consecutive declines. During today's Asian session, gold prices briefly rebounded above $4,200, reaching an intraday high of $4,207.73. Gold had touched a two-month low on Wednesday, but regained upward momentum as the US dollar and Treasury yields pulled back.
Oil Pulls Back on US-Iran Talk Expectations as Lower Treasury Yields Support Gold
The current rally in gold was primarily driven by the combined effects of falling international oil prices, a weaker US dollar, and declining US Treasury yields.
US President Trump stated that the US would not launch a military strike against Iran before the November midterm elections and said both sides were engaged in active negotiations aimed at ending the conflict. The remarks eased market fears of further crude oil supply disruptions in the Middle East. During Friday's Asian trading session, Brent crude pulled back to around $103 per barrel, while WTI crude fell to near $90.
The pullback in oil prices helped relieve market concerns that energy costs would drive up US inflation, thereby easing pressure on the Federal Reserve to raise interest rates further. Meanwhile, US Treasury yields fell for a second consecutive trading session, and the US dollar's previous upward momentum also moderated, offering support for non-yielding gold.
Notably, Thursday's auction of 30-year US Treasury bonds met with strong demand, driving down long-term Treasury yields. The 10-year US Treasury yield dipped to 5.227% at one point, falling significantly from its previous 24-year high.
However, gold still faces uncertainty surrounding Federal Reserve monetary policy. St. Louis Fed President Musalem stated that the Fed may still need to hike interest rates further to bring inflation back down to the 2% target. According to the CME FedWatch Tool, the market estimates a 19.4% probability of a Fed rate hike in October, while the probability of a rate hike in December remains at 83%.
From a market perspective, although the recent decline in oil prices and Treasury yields has improved the short-term trading environment for gold, the market has not fully ruled out the possibility of another rate hike by year-end. If upcoming US inflation data continues to slow, gold's rally could receive further support; conversely, if rate hike expectations heat up again, gold prices could still face pullback pressure.
Gold Price Technical Analysis
Gold price daily chart, Source: TradingView
Looking at the daily chart, gold prices rebounded quickly after dipping below $4,100 this week, signaling a weakening in short-term downside momentum. Meanwhile, gold broke above resistance at the 10-day moving average today, further strengthening bullish momentum and suggesting the rebound may continue in the short term.
On the upside, the primary resistance zone to watch for gold is the $4,230–$4,250 range. If gold can break higher with conviction and hold above $4,250, it will further test the $4,300 level.
On the downside, the primary support zone to watch is the $4,170–$4,150 range. If gold breaks below $4,150, it may continue to test the $4,100 mark. If $4,100 fails to hold, gold could further test the $4,000 mark.
This content was translated using AI and reviewed for clarity. It is for informational purposes only.
Recommended Articles











Comments (0)
Click the $ button, enter the symbol, and select to link a stock, ETF, or other ticker.