

Gold Prices Fall for 4 Straight Months, Has the Precious Metals Bull Market Partially Ended? Where Is the Next Support Level?


AI Podcast
Gold prices have fallen over 23% year-to-date, breaching technical bear market levels. This decline is attributed to stronger-than-expected non-farm payrolls, increased rate hike expectations, rising Treasury yields, and a stronger US Dollar, increasing the opportunity cost of holding gold. Speculative long positions have significantly reduced, and physical gold ETFs experienced net outflows. While the short-term bull market may have ended, long-term fundamentals remain solid, with central banks, including China and Poland, increasing gold holdings. Analysts suggest gold may retest $4,000 or $3,888 if inflation persists, but a broader decline requires multiple adverse factors. The market anticipates wide-range volatility between $4,000 and $4,500 until the Federal Reserve's policy path clarifies.

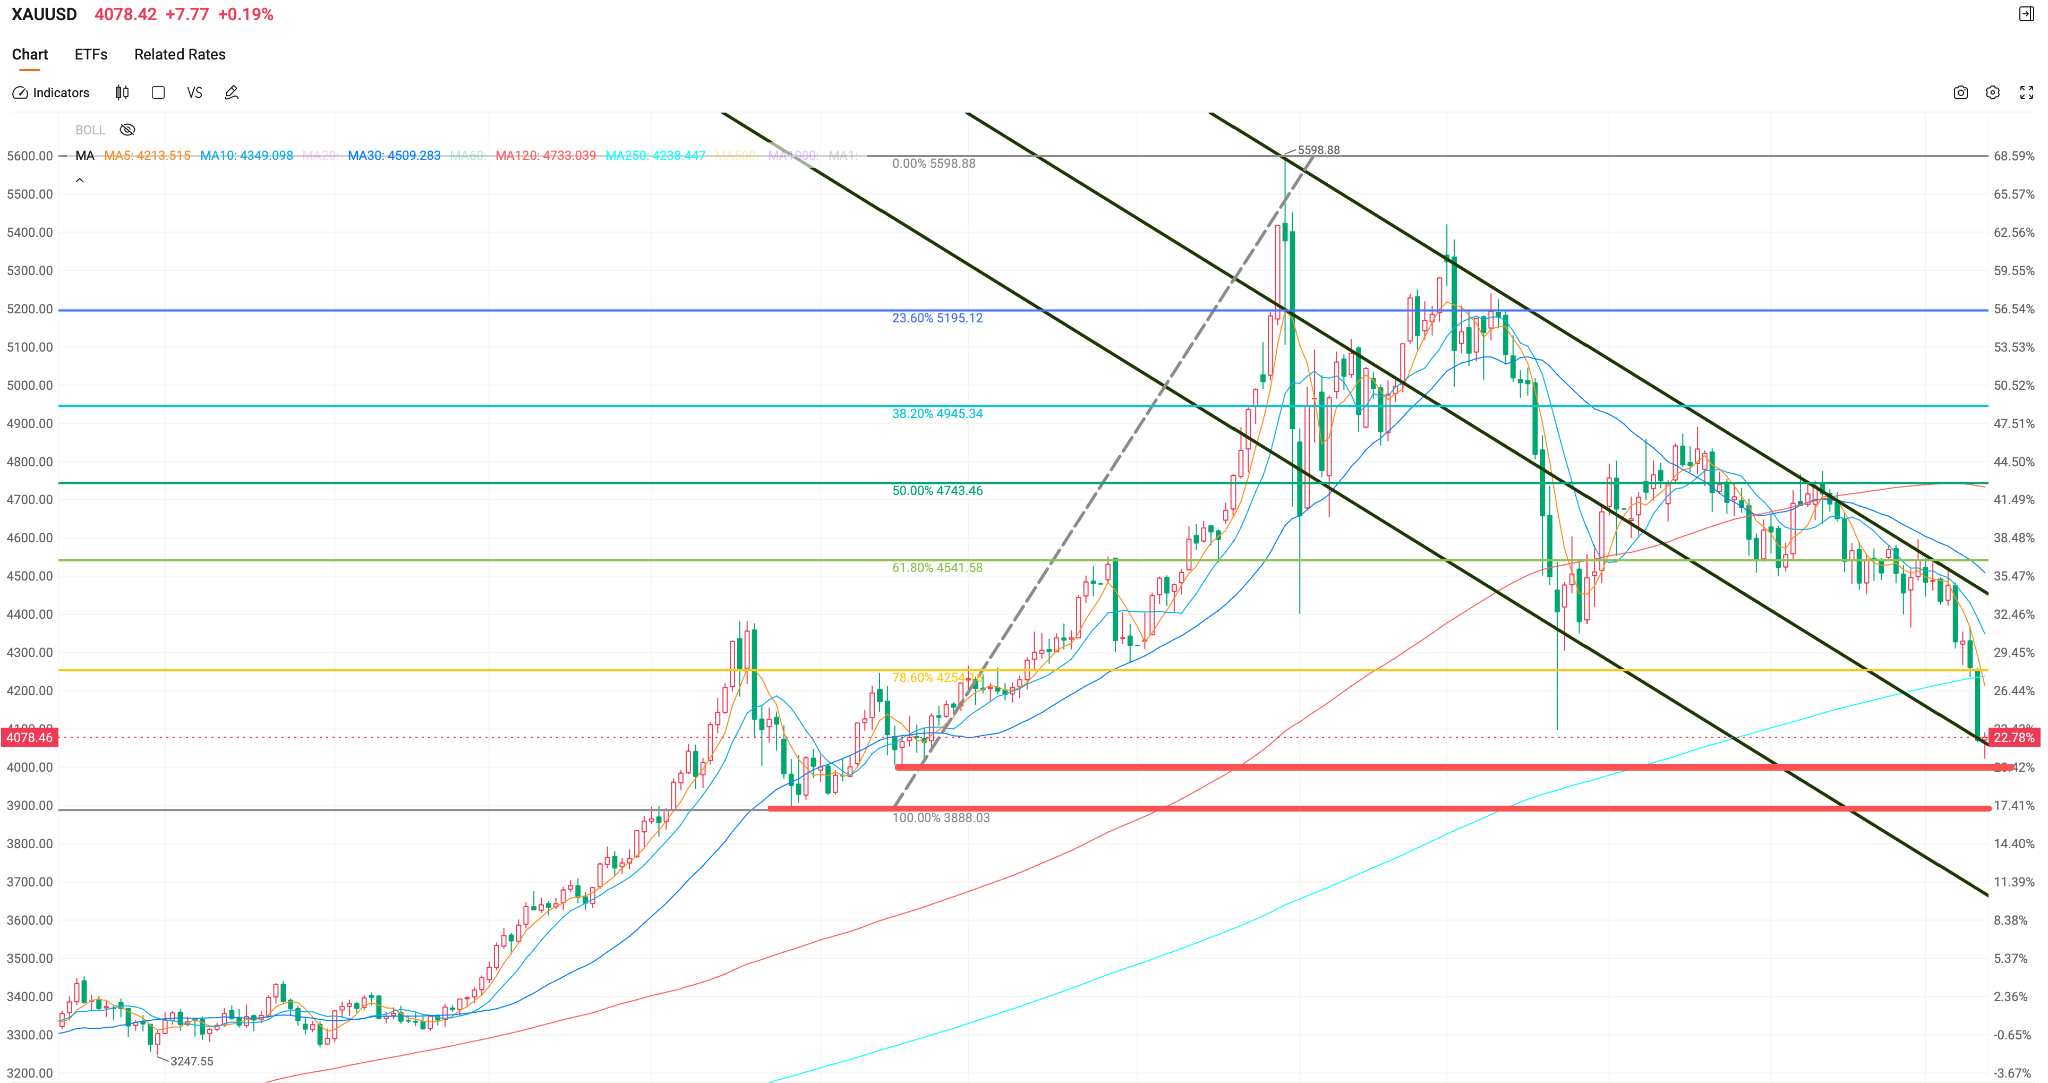
TradingKey — Year-to-date, international gold prices have fallen by more than 23% from their all-time high of $5,598.75/oz, completely erasing their gains for the year. Since peaking at the end of January, gold prices have closed lower for four consecutive months.
In the week of June 5, spot gold recorded its largest weekly decline in nearly three months, falling over 4%; on June 10, it further breached the $4,100 level, satisfying the criteria for a technical bear market.
Why are gold prices continuing to fall?
The catalyst for this sell-off was the addition of 172,000 non-farm payrolls in May, far exceeding market expectations, while data for the prior two months was revised upward by a combined 93,000. Following the report, market bets on a rate hike by year-end jumped from 48% to over 60%, the 10-year Treasury yield broke above 4.55%, and the US Dollar Index returned to levels above 100.
Rising interest rates directly pushed up the opportunity cost of holding gold. Against the backdrop of significantly higher yields on interest-bearing assets, capital continued to flow out of the gold market, which is a non-yielding asset.
Previously, hotter-than-expected inflation data—with April CPI surging 3.8% and PPI jumping 6.0% year-on-year—had already completely eroded market expectations for rate cuts. The macroeconomic outlook is rapidly shifting from a rate-cut narrative to a rate-hike narrative.
CFTC data showed that as of May 26, non-commercial net long positions in gold fell to 154,000 contracts, a 39% decline from the late-January peak and a nearly two-year low. According to the World Gold Council, global physical gold ETFs saw net outflows of $2 billion in May, reversing five consecutive months of net inflows.
Total assets under management (AUM) for gold ETFs have fallen from approximately 325.8 billion yuan at the end of the first quarter to 288.1 billion yuan, a contraction of over 37 billion yuan. Trading capital is systematically reducing bets on further upside in gold.
Has the bull market partially ended?
Technically, the local bull market in precious metals has ended. Gold prices have broken below the 250-day moving average for the first time since September 2023. Historical trends indicate that gold prices typically decline by approximately 5% after such a breakdown.
However, it is characterized as a "local end" because the nature of this decline is more accurately understood as a concentrated exodus of speculative capital.
From a long-term perspective, gold fundamentals remain solid. At the central bank level, the People's Bank of China has increased its gold holdings for 19 consecutive months, with reserves rising to 74.96 million ounces by the end of May, the largest monthly increase in nearly 15 months.
The central bank of Poland led the world in April with net purchases of 14 tons of gold. Regarding long-term capital flows, an ECB report indicates that by the end of 2025, gold's share of global central bank reserves will have risen to 27%, officially surpassing U.S. Treasuries to become the world's primary reserve asset.
Market analysis suggests that this sell-off is primarily concentrated in speculative long positions built on rate-cut expectations, where marginal shifts in interest rates forced stop-loss liquidations. In contrast, "long-term capital" such as central banks has not only remained but accumulated gold as prices fell. Trading-oriented capital is retreating while strategic capital is increasing holdings—this represents the core structural dichotomy of the current gold market.
Where is the next support level?
Analysts warn that if inflation data continues to exceed expectations, the possibility of a direct test of the $4,000 area cannot be ruled out.

Based on Fibonacci indicators, most key support levels have been breached. There is a general market expectation that this retracement will move toward the 4,000 level. Should the $4,000 mark be decisively broken, a retest of the $3,888 threshold cannot be ruled out.
Key support levels: $4,000, $3,888
Meanwhile, some market participants argue that gold prices falling below $4,000 would require a convergence of multiple factors, including a substantial interest rate hike by the Federal Reserve, a shift by global central banks from purchasing to selling gold, and a comprehensive de-escalation of geopolitical conflicts. The probability of these three variables aligning simultaneously in the short term remains limited.
Investor Allocation Perspective
For short-term traders, the market is currently in a state of high uncertainty. The upcoming June FOMC meeting will be a key directional catalyst; if rate hike expectations continue to intensify, the high-interest-rate environment will continue to suppress the short-term valuation of gold, a non-yielding asset.
For long-term allocators, the crux of the disagreement lies in the choice of a pricing anchor. If one believes gold's pricing power will return to the long-term logic of central bank accumulation and de-dollarization, this correction of over 20% provides a positioning window with a higher margin of safety than in early 2026. However, it should be noted that the current decline has yet to show signs of stabilizing, and entering in batches at support levels may be the best strategy for investors.
The probability of a unilateral downward move remains low, but the likelihood of repeated bottom-building at low levels is high. Before the Federal Reserve's policy path becomes clear, gold is likely to enter a period of wide-range volatility, with $4,000 to $4,500 remaining the mainstream consensus trading range.
This content was translated using AI and reviewed for clarity. It is for informational purposes only.
Recommended Articles


Comments (0)
Click the $ button, enter the symbol, and select to link a stock, ETF, or other ticker.