


Gold Price Forecast: Nonfarm Payrolls Looming, June Gold Expected to Break $4,800



AI Podcast


Gold prices rebounded after testing the $4,360 support level, briefly touching $4,600 on news of a potential US-Iran peace agreement, which later retreated as details remained unconfirmed. Geopolitical de-escalation may ease oil prices and inflationary pressures, potentially supporting gold. However, failure to reach an agreement could drive oil higher, reinforcing expectations of sustained high interest rates. Upcoming US non-farm payroll data is a key indicator; weaker-than-expected results could benefit gold, while strong data might limit its upside. Technically, gold exhibits a double-bottom pattern suggesting a test of the $4,800-$4,890 resistance.

TradingKey - On Friday, May 29, Eastern Time, gold prices ( XAUUSD) maintained their rebound momentum on Friday after retesting the key support level of $4,360 on Thursday. Furthermore, as the U.S. and Iran signaled that a peace agreement was nearing completion, gold prices briefly touched $4,600.
However, gold prices retreated after Iranian officials clarified that the agreement had not yet been finalized. By Friday's close, gold had pulled back more than $50 from its high of $4,595 to settle at $4,539.83.
US-Iran risks ease as non-farm payrolls set to become the next directional anchor.
As of May 30, signs of a phased de-escalation in U.S.-Iran tensions have emerged. U.S. President Donald Trump discussed whether to move forward with a U.S.-Iran agreement with his national security team on May 29, though a final decision has yet to be made.
Previously, negotiators from both sides had reached a preliminary consensus on extending the ceasefire by 60 days, restarting negotiations on the Iranian nuclear issue, and facilitating the reopening of the Strait of Hormuz. However, Iran stated that the agreement has not yet been finalized, and disagreements remain over key issues such as the nuclear program, the lifting of sanctions, and the release of frozen funds.
The primary impact of this development on gold lies in its effect on oil prices. If the agreement proceeds, transport risks in the Strait of Hormuz would decrease, easing concerns over crude oil supply. Consequently, oil prices could pull back, thereby alleviating energy-driven inflationary pressures.
In this scenario, market expectations for the Federal Reserve to maintain high interest rates may cool, putting pressure on U.S. Treasury yields and the dollar, which would instead provide support for gold. While the de-escalation of U.S.-Iran tensions is bullish for gold, the key factor will be whether the decline in oil prices fuels expectations for a Fed rate cut.
Conversely, if negotiations break down or if the Strait of Hormuz faces renewed risks of blockades and military conflict, oil prices could trend upward again. While geopolitical conflicts typically bolster gold, in the current environment, if rising oil prices lead to stronger inflation expectations, it could force the market to refocus on the Fed maintaining high interest rates for longer, or even increase the likelihood of a rate hike.
Next, the U.S. non-farm payroll (NFP) data for May will serve as another major fundamental anchor. The Bureau of Labor Statistics is scheduled to release the report on June 5, Eastern Time. In April, non-farm payrolls increased by 115,000, and the unemployment rate remained at 4.3%; the market currently expects May's job gains to be approximately 85,000 to 96,000.
If the May NFP falls short of expectations, it would indicate a continued cooling of the U.S. labor market. The market might then lower expectations for the Fed to maintain high interest rates over the long term, and a pullback in the dollar and Treasury yields would benefit gold. Conversely, if the NFP data is stronger than expected—particularly if wage growth remains sticky—it would reinforce inflationary pressures and high-interest-rate expectations, potentially limiting the room for a gold rally.
Gold Technical Analysis: Inverse Head and Shoulders Pattern Forming, Gold Price Poised to Break $4,800
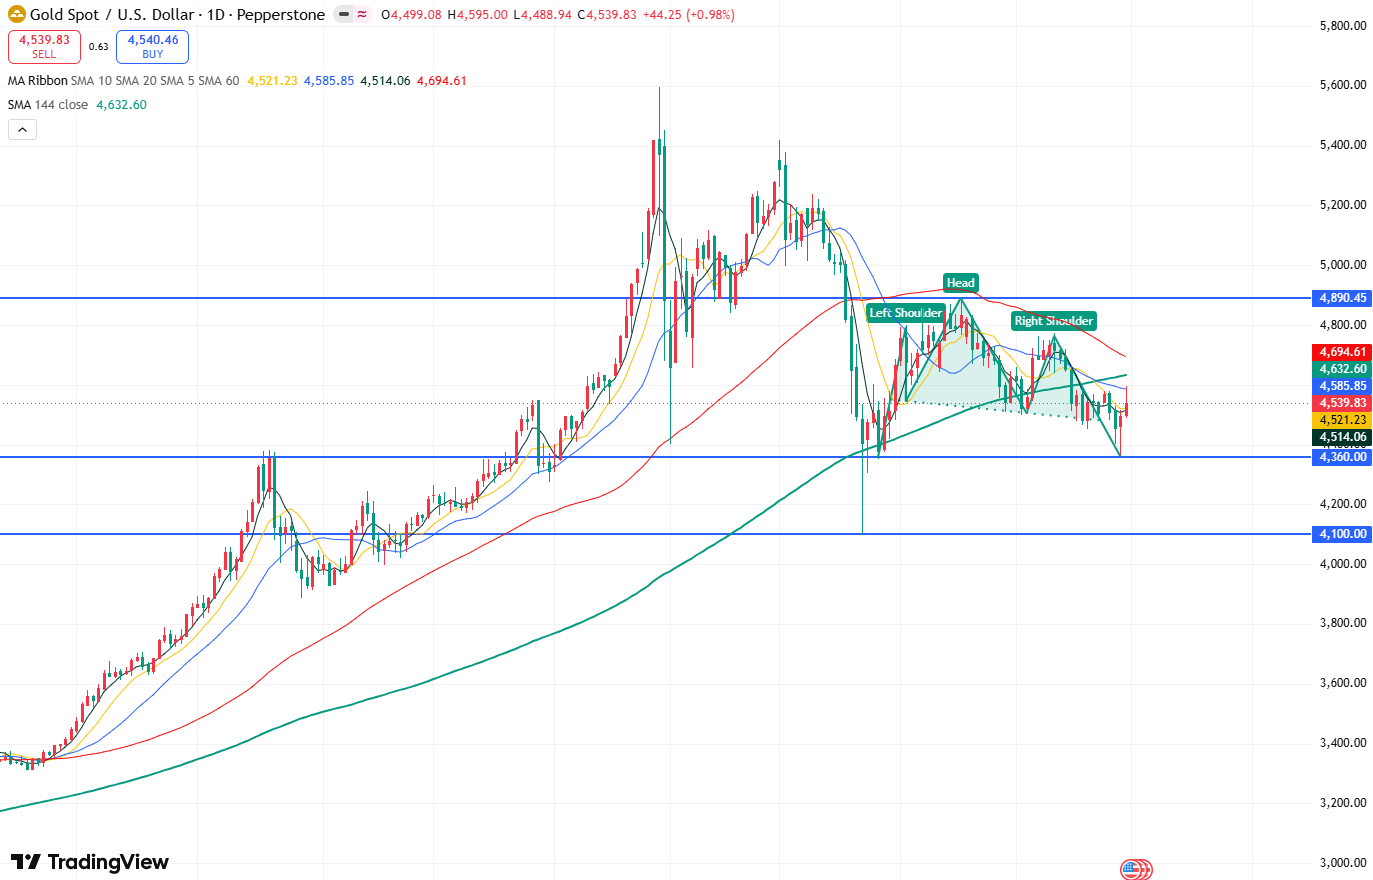
Gold price daily chart, source: TradingView
According to the daily gold chart, the price hit a low of $4,366.29 on Thursday, retesting the $4,360 support level before rebounding quickly. The session closed with a long lower shadow candlestick, indicating robust support at $4,360 and the exhaustion of bearish momentum.
Meanwhile, the daily candlestick structure formed a head-and-shoulders top, and the price has reached the target level near $4,360. The completion of this pattern has further weakened bearish momentum, thereby driving a technical corrective rally in gold prices.
Currently, the daily candlestick structure is forming a double-bottom pattern, which has significantly bolstered bullish market momentum. Gold is expected to test the $4,890 resistance level to the upside.
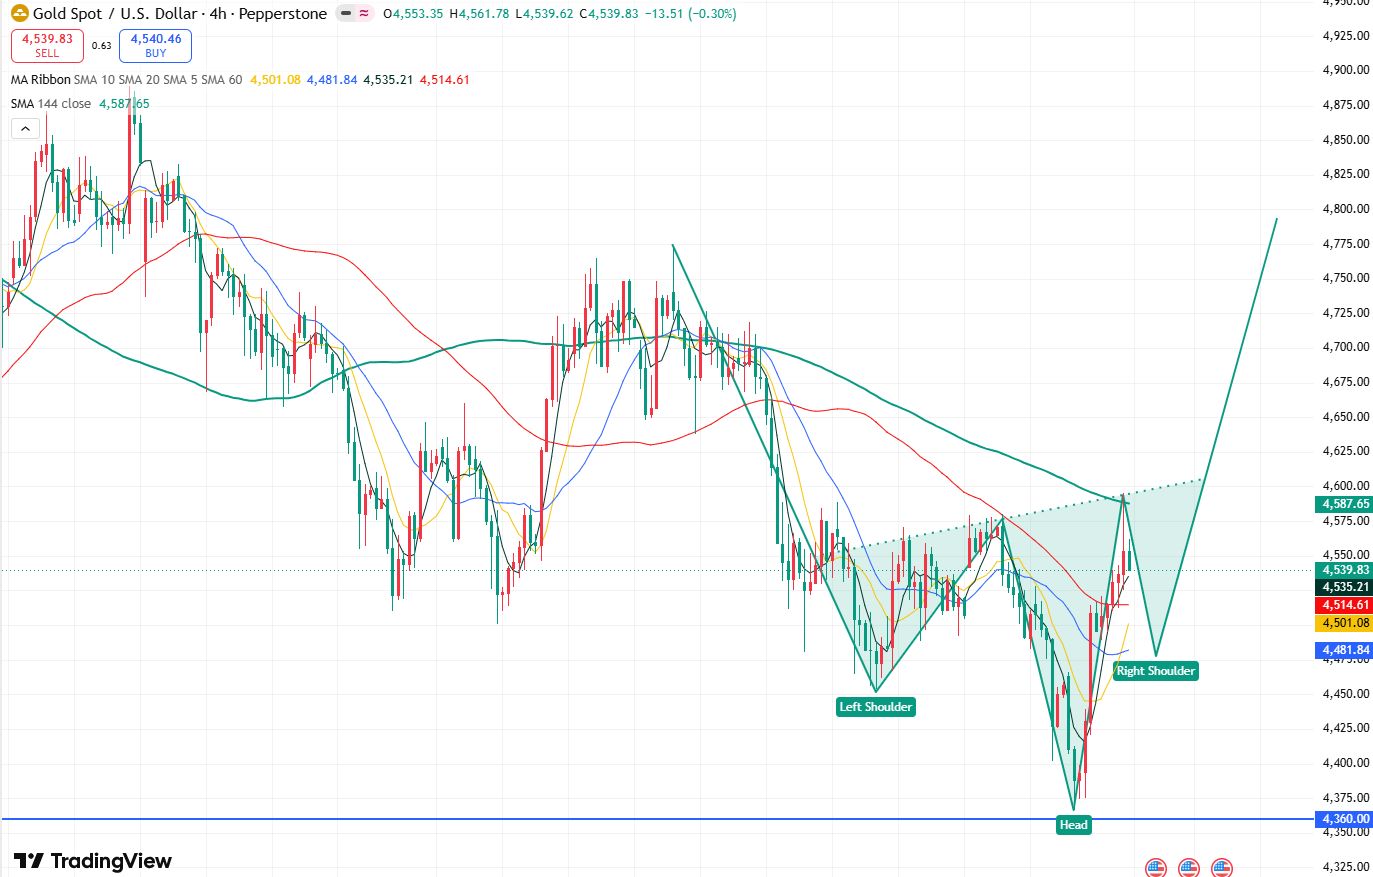
Gold price 4-hour chart, source: TradingView
On the 4-hour gold chart, the candlestick structure has formed the initial outline of a head-and-shoulders bottom pattern. Following the breakout above the $4,580 neckline, bullish momentum has significantly strengthened.
It is important to monitor whether the downward retracement breaks below the left shoulder low of $4,453. If gold confirms stabilization above this level, it would signal the formation of the head-and-shoulders bottom, supporting an initial test of the $4,800 psychological level and potentially reaching the $4,890 resistance.
Trading Recommendation: Primarily focus on buying on dips
Long Entry: 4470-4485
Stop Loss: 4450
Take Profit: 4880
Support Levels: 4510, 4453
Resistance Levels: 4800, 4890
This content was translated using AI and reviewed for clarity. It is for informational purposes only.
Recommended Articles











Comments (0)
Click the $ button, enter the symbol, and select to link a stock, ETF, or other ticker.