Ethereum Price Forecast: US-led selling keeps ETH below $2,309 realized price



Ethereum price today: $2,280
- Ethereum has seen a rejection near its $2,309 average on-chain cost basis, or realized price, over the past two days.
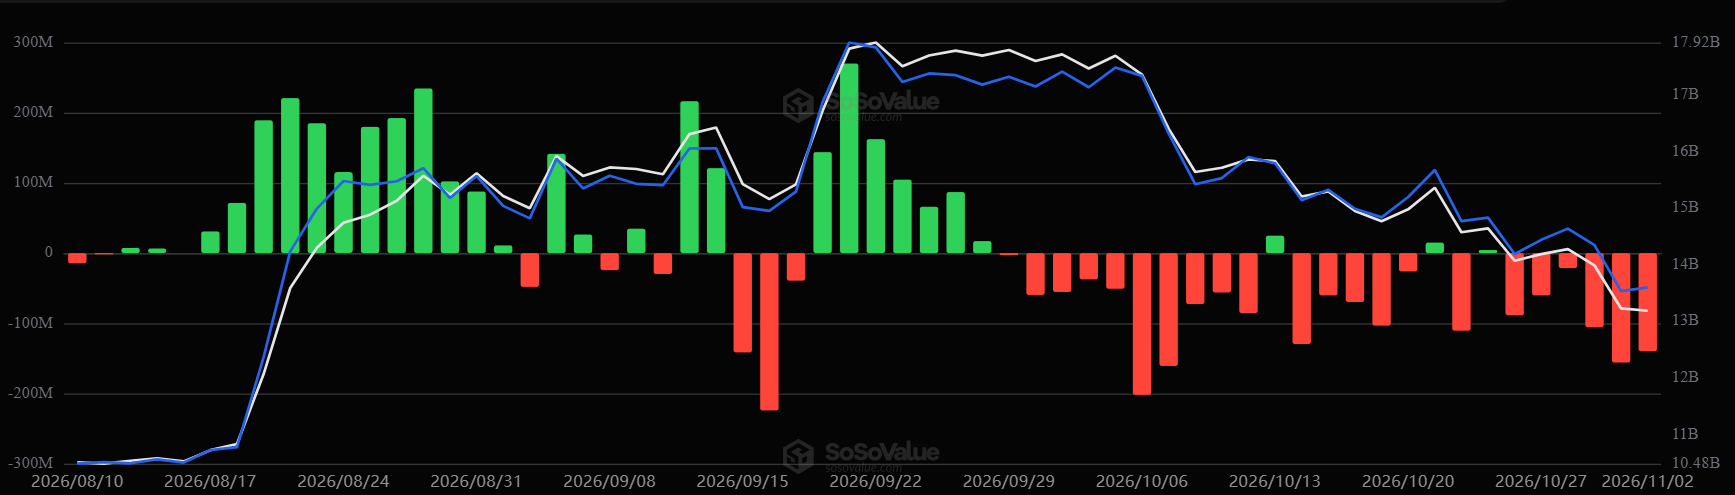
- US spot ETH ETFs continue their negative trend, with nearly $140 million in outflows.
- ETH held the $2,250 support after retesting the level.
Ethereum (ETH) faces pressure near $2,300 on Tuesday as it struggles to recover its realized price.
The top altcoin fell below its realized price, or investors' average on-chain cost basis, at $2,309 following the $6.3 billion Binance hack last Thursday.
Over the past two days, ETH has seen rejection near that level, signaling that selling is outweighing buying as price approaches it. Before last Thursday's decline, investors defended the on-chain cost basis for over a week, with prices hovering just above it.
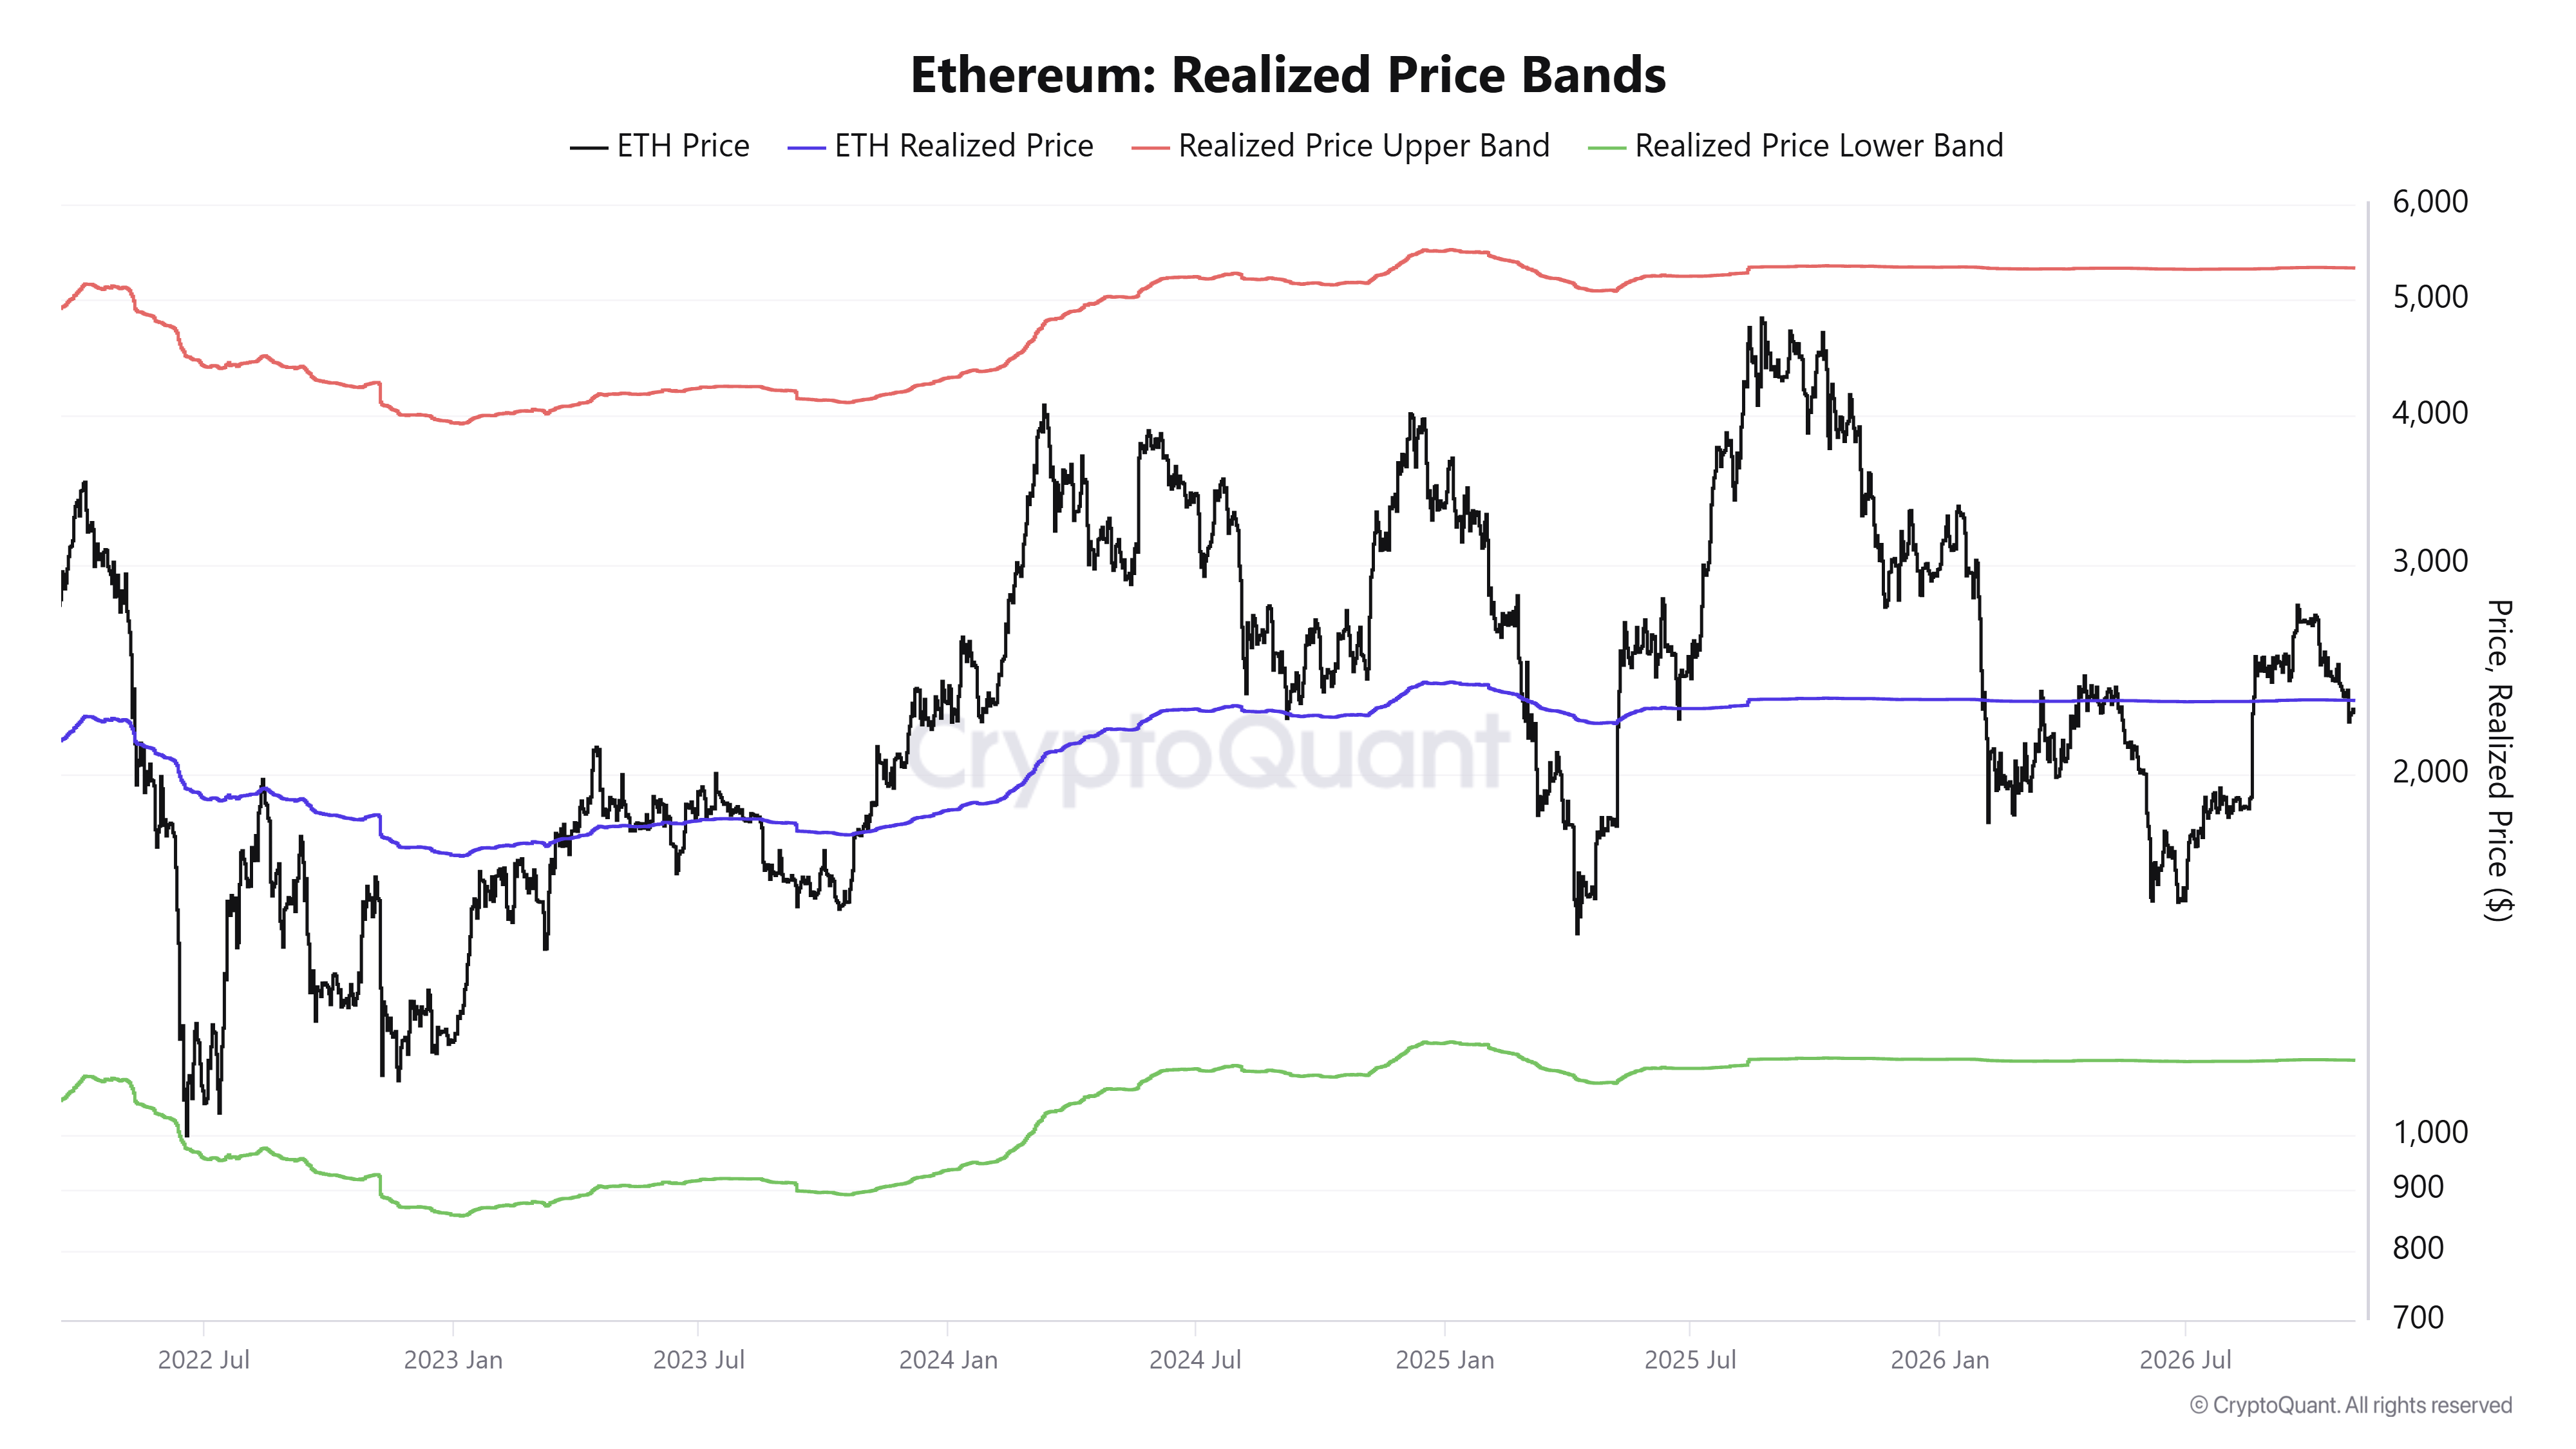
Historically, investors tend to defend the on-chain cost basis to prevent their holdings from falling into losses. On the flip side, they also tend to sell when prices fall below the cost basis to cut losses. But the underlying market structure plays a key role in determining how investors react.
US investors lead ETH selling
Selling pressure from US-based investors continues, with US spot ETH exchange-traded funds (ETFs) recording a sixth consecutive day of net outflows on Monday, worth nearly $140 million per SoSoValue data. The products posted a record monthly outflow of $1.61 billion in October.
Similarly, the Coinbase Premium Index has continued its negative trend, down to -0.161. The metric measures the difference between the ETH/USD price on Coinbase Pro and the ETH/USDT price on Binance, serving as an indicator of US traders' sentiment. The sustained decline in the metric shows that selling is dominated by US investors.
Improved ETH ETF inflows and overall US sentiment have often coincided with ETH price increases, making both metrics necessary for the top altcoin to potentially recover its realized price.
Ethereum technical outlook: ETH holds $2,250 support
Ethereum has seen $29.3 million in liquidations over the past 24 hours, led by $20.2 million in short liquidations, per Coinglass data.
On the daily chart, ETH is holding below the short- and medium-term Exponential Moving Averages (EMAs), keeping the near-term bias bearish. The 20-day EMA at $2,352, the 100-day EMA at $2,345 and the 50-day EMA at $2,411 all sit overhead as a layered cap on recovery attempts, suggesting rallies are likely to face selling pressure into this cluster. Momentum remains weak, with the 14-day Relative Strength Index (RSI) around 39 and the Stochastic Oscillator (Stoch) near 34, hinting at dominant bearish pressure.
On the downside, initial support is seen at the horizontal level of $2,250, followed by $2,204 and then $2,107 if selling extends. Deeper losses would expose the next structural floors at $1,971 and $1,827. On the topside, first resistance aligns with the convergence of the 100- and 20-day EMAs, alongside the horizontal barrier at $2,355, forming a dense supply zone. Above this, further resistance sits at the 50-day EMA, ahead of higher hurdles at $2,548, $2,636 and $2,781.
(The technical analysis of this story was written with the help of an AI tool. Know more.)